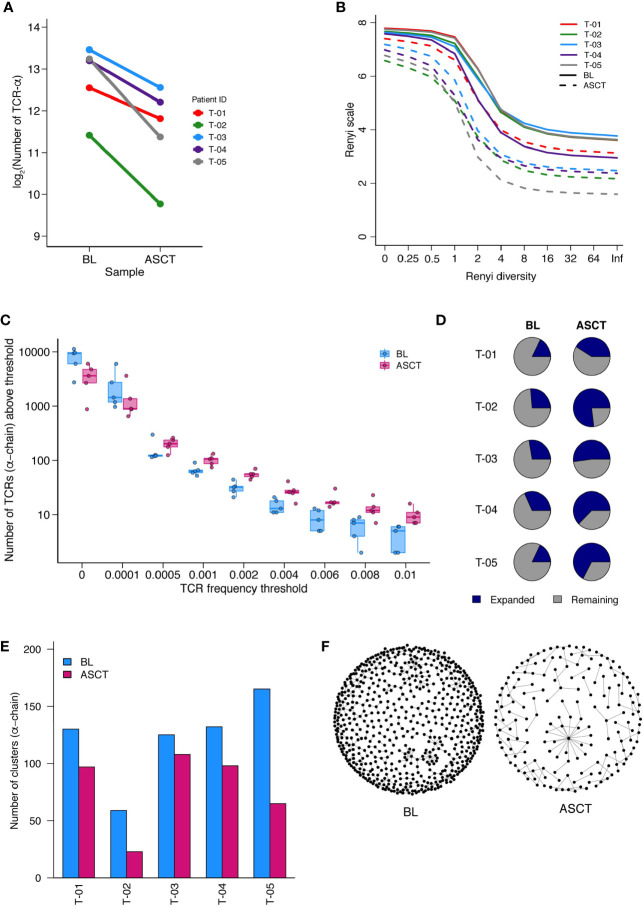
Figure 6.
TCR-Sequencing analysis of five paired patient samples at baseline (BL) and post-ASCT. (A) Number of α-chain TCR sequences collected at BL and D100 post-ASCT. Adjusted p=0.0052 by paired t-test. (B) Diversity of repertoires calculated as Renyi entropy values from 0 to infinity for the α-chain for each patient sample. Each repertoire was sub-sampled to 3000 TCRs 100 times. (C) Number of α-chain sequences detected above a given frequency threshold. Minimum and maximum values are indicated by extreme points and the thick horizontal line in the middle indicates the median value. (D) Pie-chart for each patient sample depicting the proportion of expanded (frequency >1/1,000) and unexpanded α-chain TCRs. (E) Clustering analysis then performed as a measure of sequence similarity between unique TCRs analysis on the basis of triplet amino acid sharing between two CDR3 sequences. Number of clusters from top 50 expanded α-chain CDR3 sequences per sample. (F) Representative image (T-05) of α-chain CDR3 clustering analysis. (Similarity threshold 0.80).

