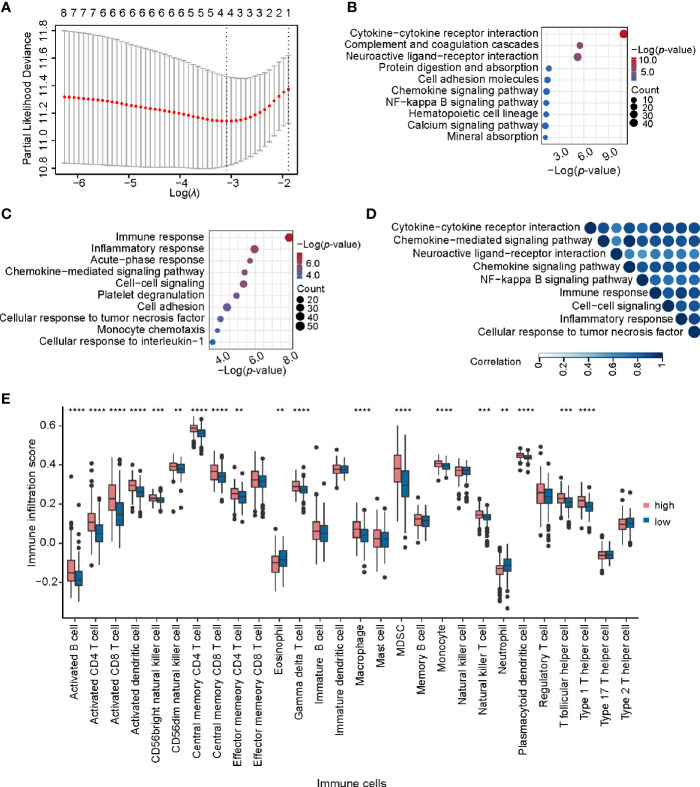
Figure 6.
Identification and analysis of key regulatory pairs in KIRC. (A) The process of building the signature using LASSO regression algorithm. (B) Biological process enrichment analysis of differentially expressed genes between high-risk and low-risk groups. (C) KEGG pathway enrichment analysis of differentially expressed genes in high-risk and low-risk groups. (D) Functional similarity analysis of gene sets in terms of biological processes. The order of enrichment items in the upper part of triangle is consistent with that of the left side. (E) Comparison of infiltration scores of 28 immune cell types between high-risk and low-risk groups. **P < 0.01, ***P < 0.001, and ****P < 0.0001.

