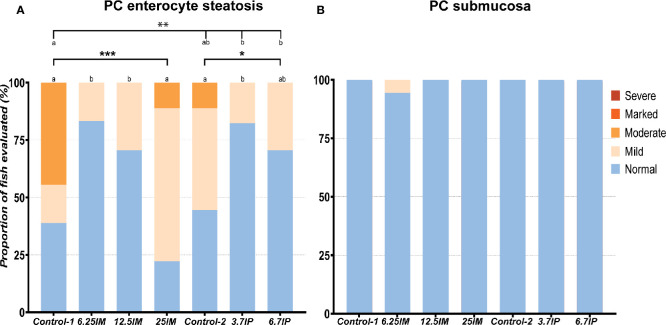
Figure 1.
Histological evaluation of pyloric caeca (PC). (A) Number of PC tissue sections that were scored “normal”, “mild”, moderate”, “marked” or “severe” for enterocyte steatosis and (B) increase in the width and inflammatory cell infiltration in the submucosa. Column charts, within each of the demarcation bars that mark Comparison 1 (Control-1, 6.25IM, 12.5IM and 25IM), Comparison 2 (Control-1, Control-2, 3.7IP, and 6.7IP) and Comparison 3 (Control-2, 3.7IP and 6.7IP), that do not share superscript letters are statistically different (p < 0.05). Asterisks denote level of significance (*p < 0.05, **p < 0.01, ***p < 0.001) following outcomes of an ordinal logistic regression for differences in distribution of histological scores between the dietary groups. Each measurement was performed in triplicate using 6 fish per tank. Control-1: Control diet. 6.25IM, 12.5IM and 25IM: BSFL meal substituted 6.25%, 12.5% and 25% of protein content of Control-1. Control-2: Control diet with 0.88% of formic acid. 3.7IP and 6.7IP: BSFL paste substituted 3.7% and 6.7% of protein content of Control-1.

