
Fig. 6. Hes.a FRAP/fusions.
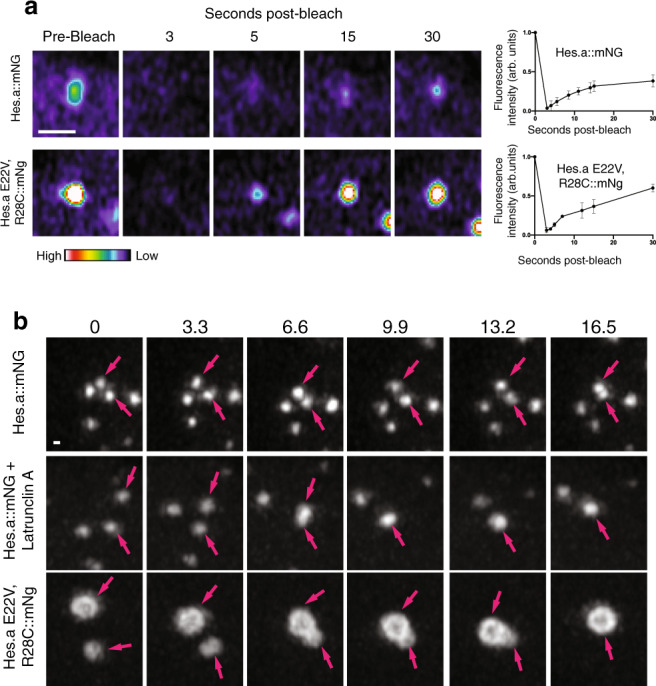
a Time-lapse maximum intensity projection confocal images of region of a single Hes.a puncta. Images show the puncta prior to photobleaching and the recovery at several timepoints. Fluorescent intensity is indicated by the look up table. Scale bar = 1 μm. b Quantification of FRAP recovery of Hes.a droplets. Dots indicate the mean and the error bars indicate the standard deviation (N = 3). c Time-lapse maximum intensity projection confocal images of Hes.a puncta. 2 puncta are indicated with arrows and if they fuse are indicated by a single arrow. Scale bar = 0.5 μm. All transgenes were expressed using pSP Sox1/2/3 > plasmids. FRAP and fusion images are representative of >3 biological replicates. Source data are provided as a Source Data file.