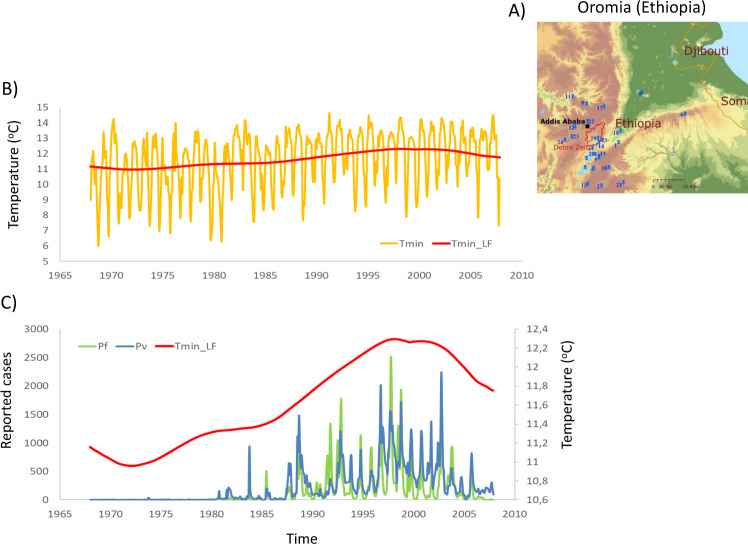
Fig. 1. Geographical setting of the Oromia region (Ethiopia) and epidemiological evolution of malaria incidence since 1968.
Elevation of the region ranges from 1600 to 2500 m above sea level from the South East to the North West respectively. A The map shows the respective locations of Oromia in Africa, the 24 weather stations used in this study (“Methods” and Supplementary Information), and the malaria surveillance region in Debre Zeit (red contour). B Evolution in minimum temperature (Tmin, yellow) and the long-term mean obtained by SSA (Tmin_LF; red line) for the interval 1968–2007 (this reconstructed component was significant at p < 0.001 against a red-noise null model; see “Methods” for technical details). C The malaria time series for both Plasmodium vivax (Pv, blue line) and Plasmodium falciparum (Pf, green line) correspond to confirmed malaria cases starting in January 1968. These data are shown together with the long-term composite minimum temperatures shown in B, an average from the 11 meteorological stations closest to the malaria surveillance area (“Methods” and Supplementary Information). There are two transmission seasons following the short (February–May) and long (June–August) rains. The main transmission season takes place from the beginning of September. (The regional map was produced with the ArcGIS software package, with an overlay of the GTOP30 digital elevation layer at 1 km × 1 km resolution obtained from USGS86).

