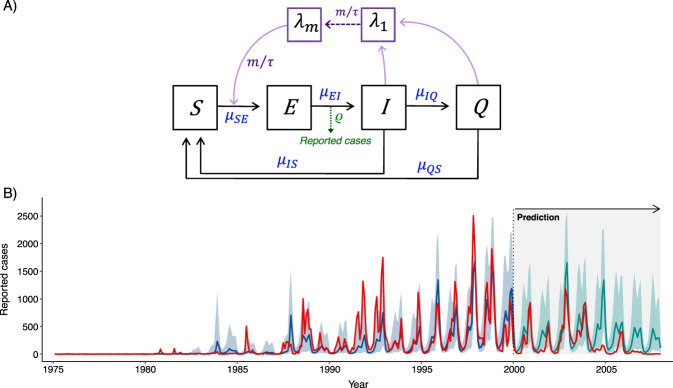
Fig. 2. Stochastic transmission model.
A Diagram of the compartmental structure of the model. The model divides the human population into classes, for susceptible (S), exposed (E), infected, and infectious (I) individuals. An additional class is introduced, Q, for asymptomatic individuals that still carry the parasite after the initial infection but transmit it to the mosquito vector at a lower rate77,78. A second part of the model represents in a phenomenological way the mosquito component. As previously described4,67, a chain of compartments (λ1,…λm) effectively implements a distributed time delay between infections in humans and the force of infection (the per-capita rate of infection) experienced by a susceptible individual. This phenomenological delay represents the joint effect of the development of the parasite within the mosquito vector and the survival of this vector. The compartment chain generates a time delay in the form of a gamma distribution, a flexible form which by contrast to the more typical exponential distribution allows for the consideration of a mode or characteristic timescale. The effect of temperature is included in the transition rate representing transmission μSE. The system of stochastic differential equations is given in the “Methods” together with the description of the measurement model (for cases reported with an error) and the way the temperature covariate enters in the transmission rate. B Comparison of predicted and observed falciparum malaria cases. The reported cases are shown in red. Median simulated cases (hindcasts) with the best model for the MLE (Maximum Likelihood Estimate) parameters are shown in blue for the time period of the training set data together with their uncertainty (shaded, for the 10% and 90% quantiles). Median predictions for the “out-of-fit” period are shown in green, also with their corresponding uncertainty. The Maximum Likelihood Estimates (MLE) for the parameters with their well-defined confidence intervals are given in Supplementary Fig. 3 and Supplementary Table included therein.

