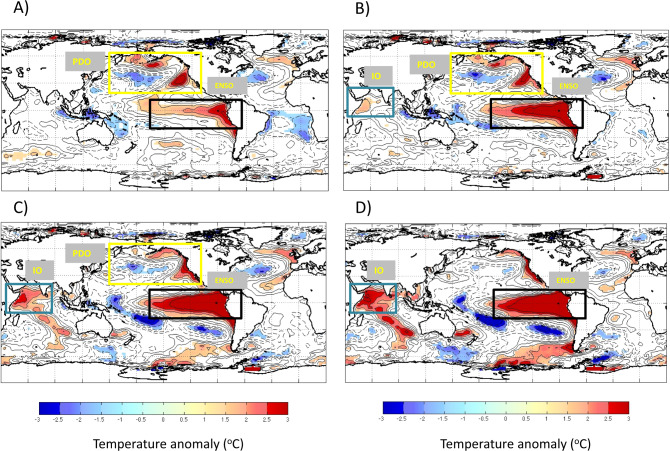
Fig. 5. Correlation maps showing the signature of Plasmodium falciparum malaria in Oromia (Ethiopia) onto values of Sea Surface Temperatures for the Pacific regions of El Niño (EN) and the Pacific Decadal Oscillation (PDO).
SDC75,76 spatial analyses are shown for the main malaria peak in the record in 1997/98, coinciding with the strongest EN event. Correlations are computed between the malaria time series and the SSTa time series at each point of the global ocean. Grid points with a significant correlation (p < 0.01) are colored. Regions of significant correlation are found within the boxes that delimit the PDO and EN regions of the Pacific, as well as the Indian Ocean (IO). The panels correspond to different months leading (−) or lagging (+) the malaria peak month in 1997/98, and show the developing and significant SST anomalies in the global ocean that are correlated with malaria incidence. SSTa, respectively, leads the malaria peak by 4 months in A and two months in B; they exhibit no lag in C and lag behind the peak by two months in D.

