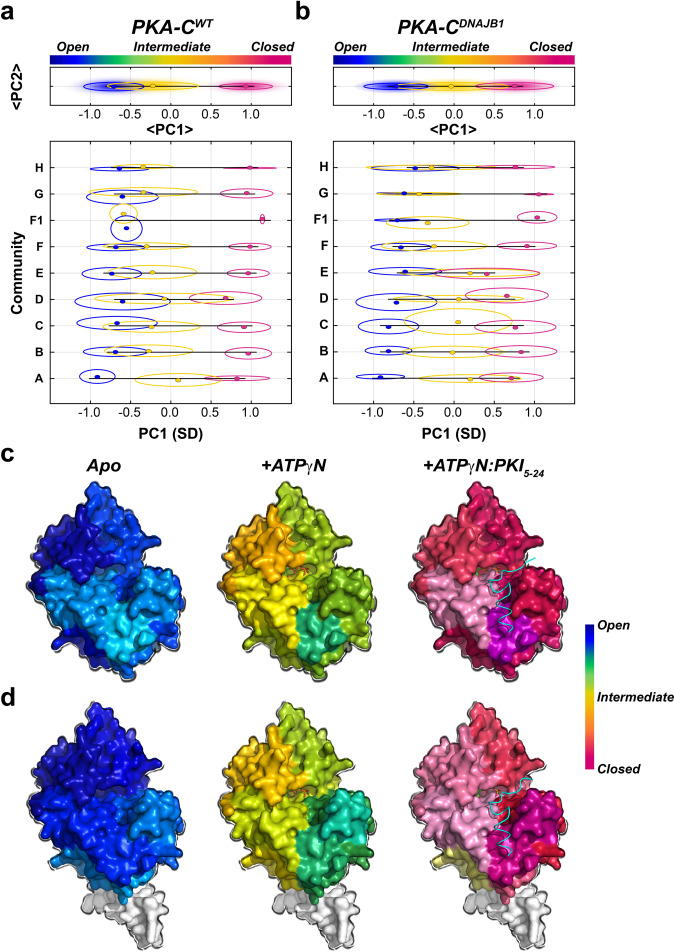
Fig. 6. Community-specific responses of PKA-CWT and PKA-CDNAJB1 upon ATPγN and PKI5–24 binding.
CONCISE analysis for each individual community for a PKA-CWT and b PKA-CDNAJB1. The top panel on the graphs shows the average PC1 (<PC1>) overall communities, whereas the bottom panel shows the PC1 scores of each individual community. CONCISE scores of each community mapped onto the surface of c PKA-CWT (PDB: 4WB5) and d PKA-CDNAJB1 (PDB: 4WB7) for each state (apo, +ATPγN, and +ATPγN/PKI5–24).

