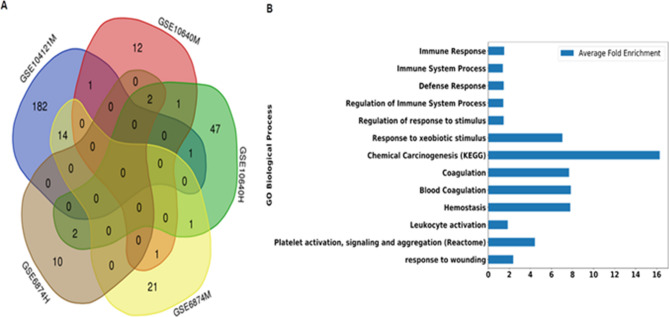
Figure 2.
Comparison of enriched biological pathways among different networks. (A) Overlap of the Gene Ontology terms (Biological Processes, Molecular Functions, and Cellular Compartments) and pathways (KEGG pathways, Reactome pathways, BioCyc) in each network based on 5% False Discovery Rate (FDR). The venn diagram was created using http://bioinformatics.psb.ugent.be/webtools/Venn/14 (B) Average fold enrichment of biological processes and pathways that were enriched in more than one network.

