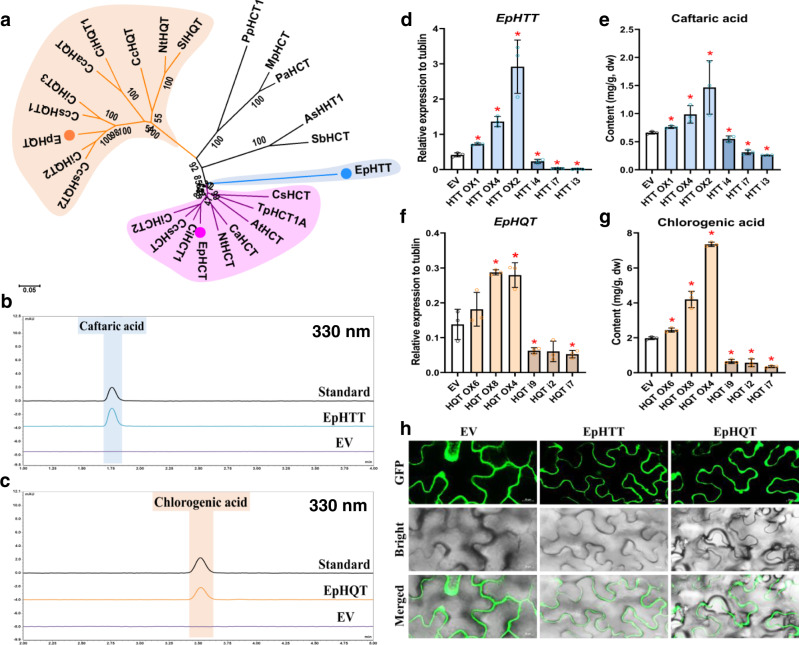
Fig. 2. Two cytosolic BAHD acyltransferases catalyze the synthesis of caftaric acid and chlorogenic acid.
a Phylogenic analysis of EpHTT, EpHQT, and EpHCT with functionally identified BAHDs. GeneBank ID of the proteins used in the tree are listed in methods. The HQT and HCT clades are highlighted in orange and pink, respectively, and EpHTT is highlighted in blue. UPLC detection of caftaric acid and chlorogenic acid production by EpHTT (b) and EpHQT (c), respectively. d Relative expression levels of EpHTT and e caftaric acid contents in transgenic overexpression (OX) and RNAi (i) hairy root lines. f Relative expression levels of EpHQT and g chlorogenic acid contents in transgenic hairy root lines. Data are mean ± s.d. (n = 3 biologically independent samples). * indicates significant difference from empty vector (EV) control line (P < 0.05) analyzed by two-sided Student’s t-test. *P = 0.0013 (HTT OX1), *P = 0.0005 (HTT OX4), *P = 0.0047 (HTT OX2), *P = 0.0163 (HTT i4), *P = 0.0003 (HTT i7), *P = 0.0002 (HTT i3) in d; *P = 0.0072 (HTT OX1), *P = 0.0230 (HTT OX4), *P = 0.0430 (HTT OX2), *P = 0.0302 (HTT i4), *P = 0.0002 (HTT i7), *P = 0.000008 (HTT i3) in e; *P = 0.0042 (HQT OX8), *P = 0.0118 (HQT OX4), *P = 0.0420 (HQT i9), *P = 0.0298 (HQT i7) in f; *P = 0.0053 (HQT OX6), *P = 0.0013 (HQT OX8), *P = 0.0000004 (HQT OX4), *P = 0.0001 (HQT i9), *P = 0.0005 (HQT i2), *P = 0.000009 (HQT i7) in g. h Cytosolic localization of EpHTT and EpHQT in Nicotiana benthamiana leaves. Scale bars show 20 µm. This experiment was repeated independently three times with similar results. Source data underlying d-g are provided as a Source Data file.

