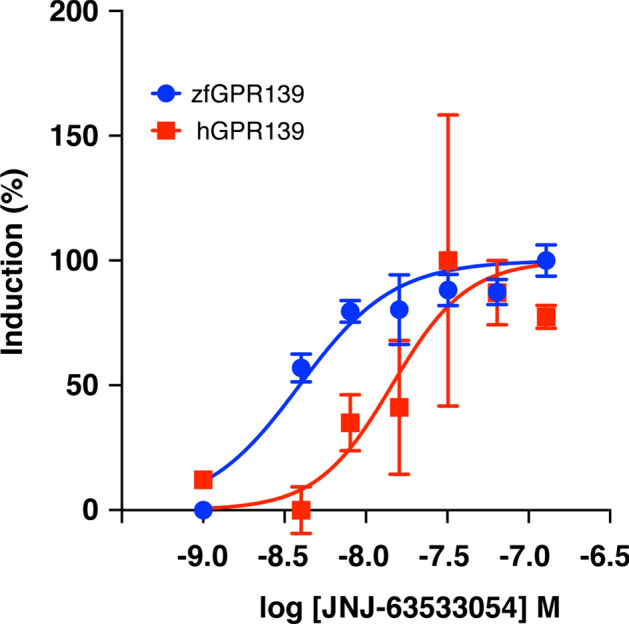
Figure 2.

Dose–response curves for luciferase induction by GPR139 agonist JNJ-63533054 upon zebrafish GPR139 in HEK293-T cells. Graphs showing concentration-dependent induction firefly luciferase activity divided by Renilla luciferase activity (%) in the HEK 293 T cells expressing zebrafish GPR139 (blue) and human GPR139 (red) by JNJ63533054 (4 ~ 128 nM). The EC50 values (3.91 nM and 14.45 nM for zebrafish GPR139 and human GPR139, respectively) were calculated by nonlinear regression analysis of the dose–response curves generated using the Prism 9 program. All data points are representative of three independent experiments performed in duplicate.
