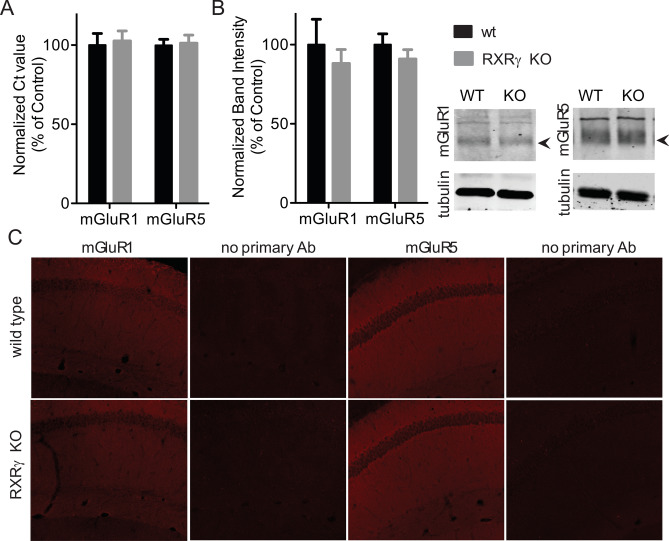
Figure 3.
Loss of RXRγ does not affect mGluR1 or mGluR5 expression. (A) mGluR1 and mGluR5 RNA is present in equivalent amounts in hippocampal homogenates from RXRγ KO and WT mice as measured by quantitative RT-PCR (T-test: t = 0.2564, P = 0.8028 for mGluR1 and t = 0.2093, P = 0.8384 for mGluR5, N = 6 animals per group run in triplicate). (B) mGluR1 and mGluR5 protein is present in equivalent amounts in hippocampal homogenates from RXRγ KO and WT animals as measured by quantitative western blotting. N = 4 animals per group run in duplicate. No significant differences between genotypes for either protein by T-test (t = 0.6477, P = 0.5412 for mGluR1 and t = 1.008, P = 0.3217 for mGluR5). At right, representative images of western blots showing anti-mGluR1 or mGluR5 and corresponding anti-tubulin immunoreactivity from WT and RXRγ KO mice. (See also uncropped images in Fig. S1). (C) Comparable levels and distribution of mGluR1 and mGluR5 protein in the hippocampal CA1 region by qualitative immunohistochemistry. Representative images of immunostained hippocampal CA1 region tissue in sections prepared from 3 animals per genotype processed in parallel with anti-mGluR1 or anti-mGluR5 primary antibody or with primary antibody omitted. Data were plotted using Prism (https://www.graphpad.com/scientific-software/prism/) and images prepared using Image Studio (https://www.licor.com/bio/image-studio/) and Olympus Fluoview (http://www.olympusconfocal.com/products/fv1000/fv1000software.html) software. The figure was assembled using Affinity Designer (https://affinity.serif.com/en-gb/designer/) software.

