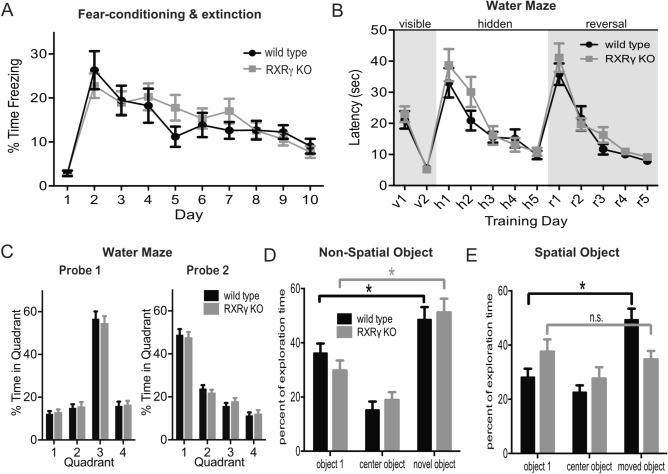
Figure 5.
Animals lacking RXRγ exhibit impaired performance in a spatial version of a novel object recognition task, but normal performance in non-spatial object recognition, Morris water maze learning, and contextual fear conditioning. (A) Plot of average percent of time spent freezing ± SEM during 2 min of pre-shock exposure to a conditioning chamber as well as the first 2 min of each 10 min re-exposure to that environment on each of the following 9 days for 18 RXRγ KO animals and 16 wild type siblings revealed no differences in baseline freezing (T-test: t = 0.2340, P = 0.8165), conditioned fear response at 24 h (T-test: t = 0.7031, P = 0.4871), or extinction of conditioned fear response (2-way RM-ANOVA: F(8,256) = 21.97, P < 0.0001 for effect of trial, F(1,32) = 0.1310, P = 0.7198 for genotype). (B) Plot of average latency to reach escape platform ± SEM over 4 trials per day during the visible platform, hidden platform, and reversal phases of a Morris water maze task for 17 RXRγ KO animals and 17 wild type siblings revealed no differences between groups (2-way RM-ANOVA: F(1,32) = 0.1200, P = 0.7313, F(1,32) = 2.116, P = 0.1555, and F(1,32) = 1.195, P = 0.2825 for genotype during visible, hidden and reversal stages respectively). (C) Histograms of average percent time ± SEM spent in each of 4 quadrants of the water maze during 1 min probe trials conducted at the end of day H5 (probe 1) and R5 (probe 2) of the water maze task shown in B revealed no significant difference between RXRγ KO animals (gray) and wild type siblings (black) (2-way RM-ANOVA: F(3,96) = 128.9, P < 0.0001 for quadrant, and F(1,32) = 1.336, P = 0.2563 for genotype for probe 1; and F(3,96) = 123.5, P < 0.0001 for quadrant, and F(1,32) = 0.2819, P = 0.5991 for genotype for probe 2). (D) Histogram of average percent of time ± SEM spent exploring two familiar objects (object 1 and center object) and one novel object during a non-spatial novel object recognition test revealed no differences between RXRγ KO animals (N = 17) and wild type siblings (N = 20) (2-way ANOVA shows significant effect of object (F(2,70) = 23.77, P < 0.0001) but not genotype (F(1,35) = 1.094, P = 0.3028). Tukey’s post-hoc test reveals significant differences in exploration time for object 1 vs. novel object (P = 0.0051 for WT and 0.0088 for KO). (E) Histogram of average percent time ± SEM spent exploring two familiar objects (object 1 and center object) and one novel object during a spatial version of a novel object recognition test revealed significant differences between RXRγ KO animals (N = 12) and wild type siblings (N = 12). 2-way ANOVA shows significant object × genotype interaction (F(2,44) = 4.102, P = 0.0233). Tukey’s post-hoc test reveals significant differences in exploration time for object 1 vs. novel object for wild type (P = 0.0046), but not RXRγ KO animals (P = 0.8940). Data were plotted using Prism (https://www.graphpad.com/scientific-software/prism/) and the figure assembled using Affinity Designer (https://affinity.serif.com/en-gb/designer/) software.

