Fig. 1.
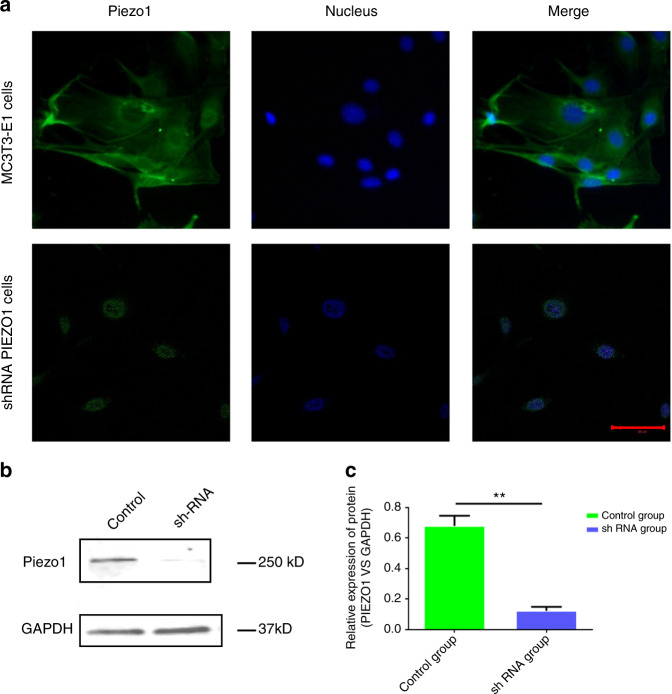
Expression of Piezo1 in MC3T3-E1 and shRNA-Piezo1 MC3T3-E1 cells. a Piezo1 (green) was expressed on MC3T3-E1 cells and localized at the plasma membrane and nucleus (blue). The protein expression of Piezo1 was decreased in shRNA-Piezo1 cells, especially on the plasma membrane. Piezo1 was expressed only around the nucleus in the shRNA-Piezo1 cells. The scale bar is 50 μm. b, c Western blot analysis showed that the Piezo1 protein expression in the shRNA-Piezo1 MC3T3-E1 group was significantly lower than that in the control group (n = 3, P < 0.01, Student’s t-test)

