Fig. 5.
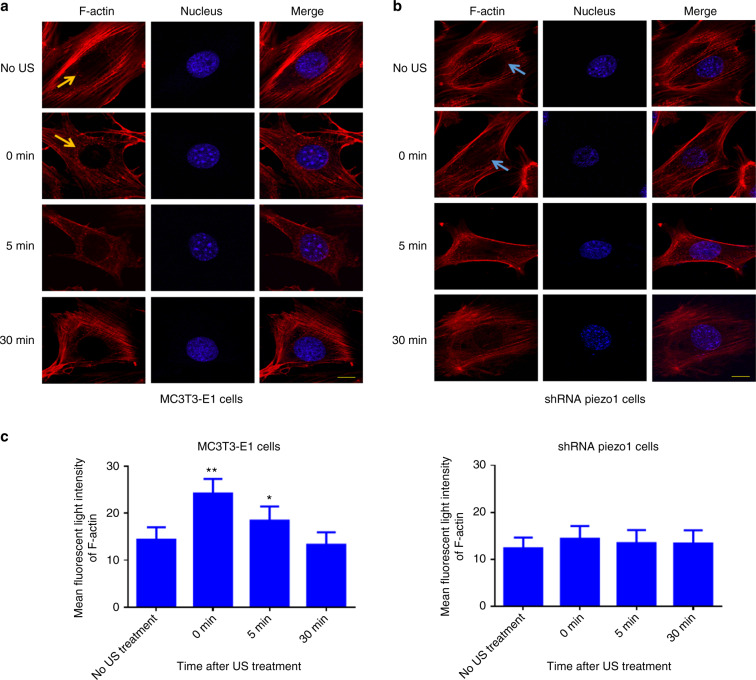
Polymerization of perinuclear F-actin after LIPUS stimulation. a, b Representative fluorescence images of Phalloidin-iFluor-labeled F-actin around the nuclei in MC3T3-E1 and shRNA-Piezo1 cells. The orange arrows in a and blue arrows in b indicate perinuclear F-actin. Scale bars: 10 μm. c The mean fluorescence intensity of perinuclear F-actin was measured and analyzed with ImageJ at the indicated time points (0, 5, and 30 min) after LIPUS stimulation (n = 9, *P < 0.05, **P < 0.01, Student’s t-test)

