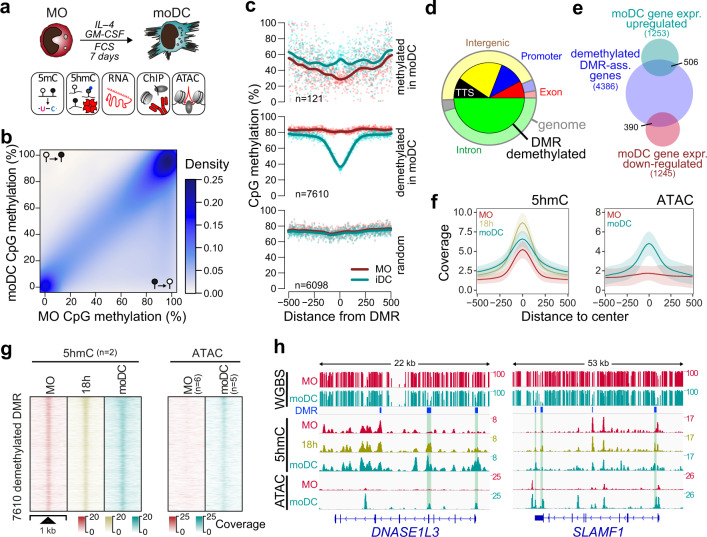
Fig. 1. DNA demethylation during MO differentiation correlates with dynamic changes in 5hmC and increasing chromatin accessibility.
a Schematic of the experimental setup for in vitro MO differentiation into moDC and downstream methodologies. b Scatterplot showing the density distribution of average DNA methylation ratios (WGBS) in MO (n = 4) and moDC (n = 6). c Genomic distance distribution of averaged DNA methylation ratios (at single CpG resolution) centered on differentially methylated regions (DMR), methylated or demethylated in moDC and random regions. Lines represent spline curves across individual data points. Sample types are indicated by coloring. d Pie chart illustrating the genomic location distribution of DMR demethylated in moDC (inner circle) relative to the entire genome. e Venn diagram depicting the overlap between genes associated with DMR demethylated in moDC and genes up- or downregulated during GM-CSF/IL4-driven MO differentiation. f Genomic distance distribution of 5hmC enrichment and ATAC coverage centered on DMR demethylated in moDC. Shaded bands represent the 95% confidence intervals. g Distribution of the 5hmC and ATAC-seq signals across DMR demethylated in moDC in MO and moDC. h IGV genome browser tracks of example regions (DNASE1L3 and SLAMF1 loci) including CpG methylation ratios (WGBS), 5hmC and ATAC-seq coverage in MO and moDC, as well as the genomic locations of DMR. Highlighted DMR (green boxing) indicate regions demonstrating increased chromatin accessibility and increased 5hmC deposition during differentiation. (c, d, f, g) Source data are provided as a Source Data file.

