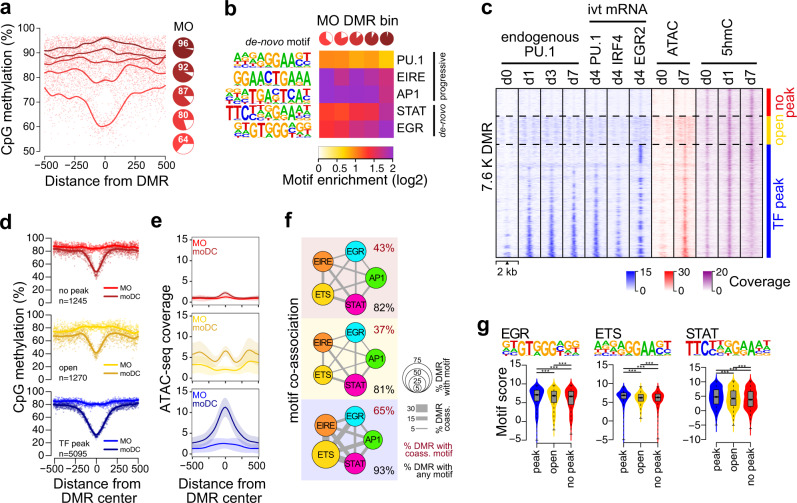
Fig. 3. TF signatures at DMR.
a Genomic distance distribution of mean methylation ratios in MO centered on DMR demethylated in moDC. Pie charts represent the mean methylation level (in red) of DMR quantiles (1.5K each) sorted by their mean methylation ratio in MO. b Heatmap of motif enrichment (compared to background) for the indicated TF contingent on DMR quintiles based on the methylation state of MO (pie charts shown on the top and in (a)). c Distribution of ChIP-seq (native PU.1 and FLAG-tagged versions of PU.1, IRF4, and EGR2 derived from transfected, in vitro-transcribed (ivt) mRNA), ATAC-seq, and 5hmC signals across the 7610 DMR demethylated in moDC at the indicated time points of moDC differentiation. DMR are divided into three majors groups characterized by detectable TF binding (blue, “TF peak”), the presence of open chromatin without detectable TF binding (yellow, “open”), and the absence of open chromatin and lack of detectable TF binding (red, “no peak”). d Genomic distance distribution of averaged DNA methylation ratios in MO and moDC centered on DMR demethylated in moDC in “TF peak” (n = 5058), “open” (n = 1270), and “no peak” (n = 1245) groups. e Genomic distance distribution of ATAC-seq coverage in MO and moDC centered on DMR demethylated in moDC in “TF peak”, “open”, and “no peak” groups. Shaded bands represent the 95% confidence intervals. f Motif co-association networks for “TF peak”, “open”, and “no peak” groups. The size of each node represents the motif enrichment (fraction of peaks) and co-associated TF motifs are indicated by coloring. Edge thickness indicates the frequency of motif co-association. The fraction of DMR with co-associated motifs and the fraction of DMR with any motif are given above and below each network, respectively. g Combined bean and box plot showing EGR, ETS, and STAT motif log-odds score distributions for “TF peak”, “open”, and “no peak” groups. Solid bars of boxes display the interquartile ranges (25–75%) with an intersection as the median; whiskers represent max/min values. Significantly different motif score distributions in pairwise comparisons are indicated (***P < 0.001, Mann–Whitney U test, two-sided). (a, b, d–g) Source data are provided as a Source Data file.

