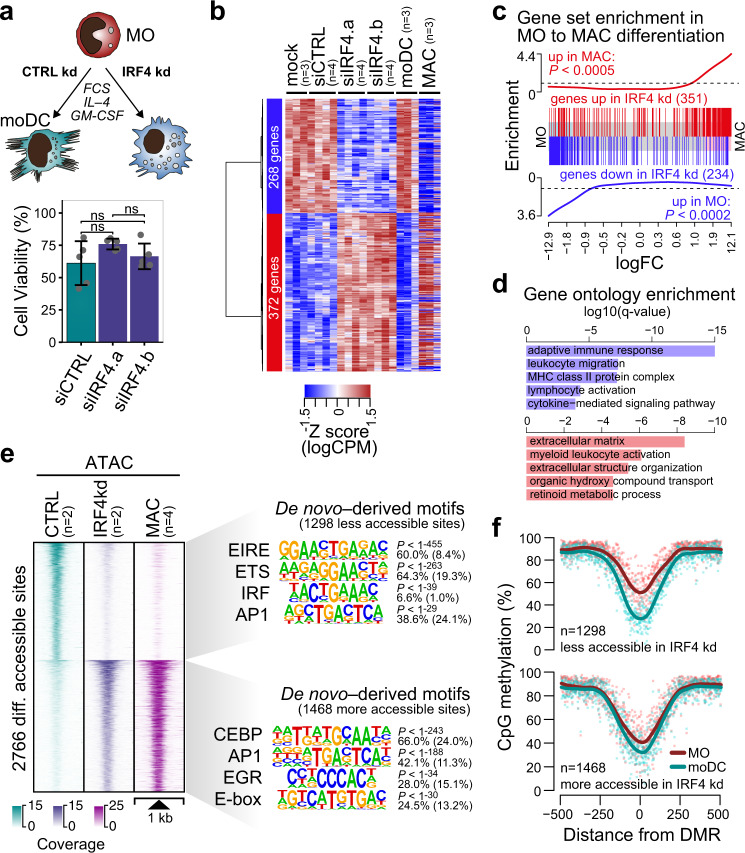
Fig. 4. Effect of IRF4 knock-down on MO differentiation.
a Schematic of the experimental setup and effect of siIRF4 treatment on moDC viability. Bars in the bottom panel represent mean ± SD of n = 5 biologically independent experiments. Individual data points are shown as gray dots (ns, not significant, paired t-test, two-sided). b Heatmap presenting hierarchically clustered and scaled expression data of differentially expressed genes in control- (mock, siCTRL) versus siIRF4-treated cells (absolute logFC > 1, logCPM and logRPKM > 1, and FDR < 0.05). Each column corresponds to an individual donor. For comparison, expression data of independent cultures of moDC and MAC were included into the heatmap before scaling. c Barcode plots showing the enrichment of the indicated gene sets (red: up in siIRF4-treated cells; blue: in siIRF4-treated cells) across the logFC ranked gene list of MO to MAC differentiation. Enrichment P-values of two-sided rotation gene set tests are given. d Gene Ontology (GO) terms associated with genes upregulated (red bars) or downregulated (blue bars) in siIRF4-treated compared to control-treated cells, as analyzed by Metascape. Bars represent corrected, log-transformed P-values (q-values) of the GO term enrichment. e Distribution of ATAC-seq signals across the differentially accessible sites between control- and siIRF4-treated samples. ATAC-seq signals of MO-derived MAC are plotted across the same regions for comparison. De novo-derived motifs for each cluster are given along with the significance of motif enrichment (hypergeometric test) and the fraction of motifs in peaks (background values are in parenthesis). Top motifs corresponding to known factor families are shown for each cluster. f Genomic distance distribution of averaged DNA methylation ratios in MO and moDC centered on differentially accessible sites (as introduced in (d)). (a–f) Source data are provided as a Source Data file.

