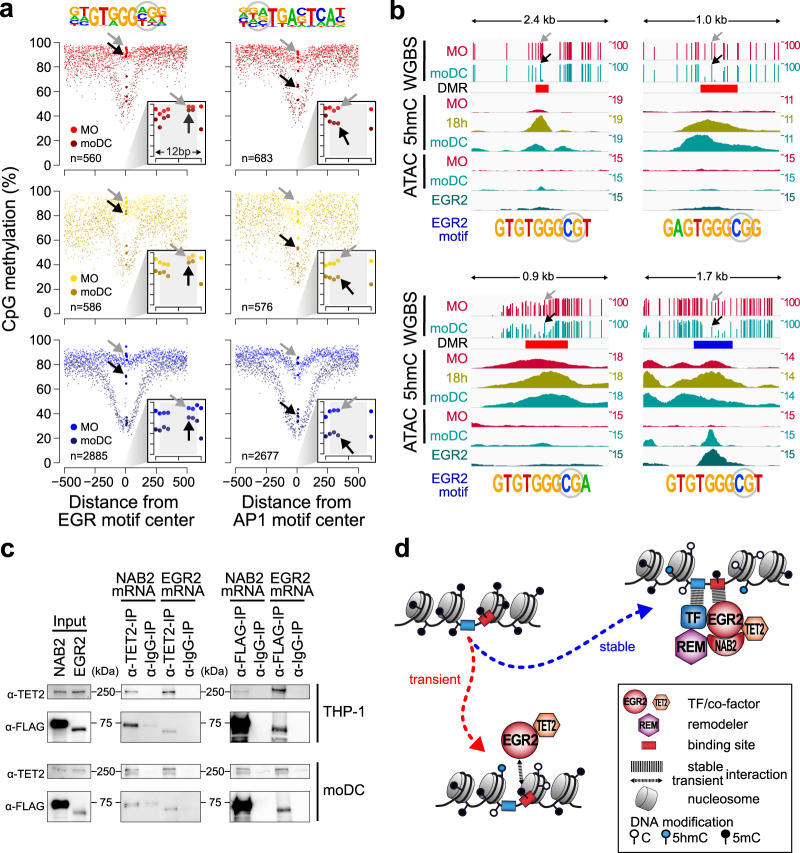
Fig. 6. Methylation footprint and TET2 interaction of EGR2.
a Genomic distance distribution of averaged DNA methylation ratios in MO and moDC across “TF peak”, “open”, and “no peak” groups (in blue, yellow, and red, respectively, as defined in Fig. 3c) of DMR demethylated in moDC. DMR were centered on the consensus EGR (left panel) or AP1 motifs (right panel), which are shown on top of each panel (CpG positions that are highlighted by arrows in gray (MO) and black (moDC) in the lower panels are circled). Each panel shows the distribution of DNA methylation ratios across a 1-kb window (large graph) as well as a 12-bp window focusing on the motif-covered CpGs only (smaller inlay graph in the bottom right corner). The number of motifs containing DMR is given in the lower left corner of each panel. b IGV genome browser tracks of example loci showing single CpG methylation ratios (WGBS), 5hmC and ATAC-seq coverage in MO and moDC, and EGR2 ChIP-seq coverage in moDC. Genomic locations of DMR are shown (coloring according to the classification into DMR groups “no peak” or “TF peak” in red or blue, respectively). EGR motif sequences are given below each track and arrows in the top tracks mark the positions of the circled CpG. c CoIPs of EGR2 or NAB2 (expressed as FLAG-tagged proteins via mRNA electroporation) and TET2 in THP-1 and moDC. Results are representative of two independent experiments. d Model of EGR2-induced DNA demethylation at transient and stable binding sites in moDC. (a, c) Source data are provided as a Source Data file.

