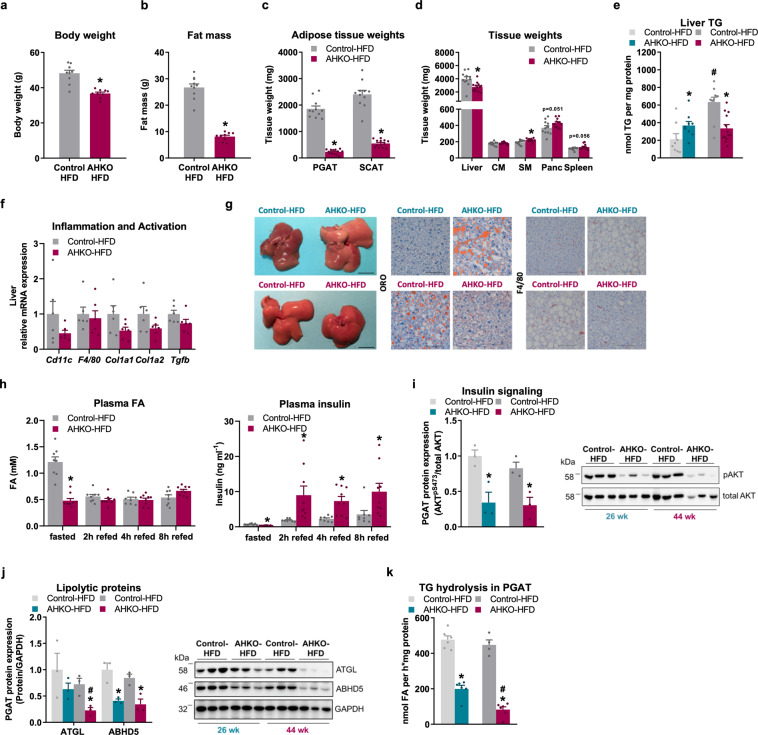
Fig. 4. Effects of longitudinal adipocyte-specific HSL deletion on systemic and tissue-specific lipid metabolism.
a Body weight and b total fat mass (M, 44 weeks, HFD, ad libitum fed, n = 9–10 animals/genotype). c Adipose tissue weights (PGAT, SCAT) (M, 46 weeks, HFD, ad libitum fed, n = 11–13 animals/genotype). d Tissue weights of non-adipose tissues (CM cardiac muscle, SM skeletal muscle [quadriceps], Panc pancreas) (M, 46 weeks, HFD, ad libitum fed, n = 11–13 animals/genotype). e Liver TG content (M, 26 and 46 weeks, HFD, ad libitum fed, n = 10–13 animals/genotype). f Hepatic mRNA expression of immune cell markers and genes involved in fibrosis relative to Cyclophilin reference gene by qPCR with control animals arbitrarily set to 1 for each gene (M, 44 weeks, HFD, ad libitum fed, n = 6 animals/genotype). g Representative gross images (scale bar: 1 cm) and histological staining of liver sections with ORO (neutral lipids) and against F4/80-postive immune cells (scale bar: 100 µm; M, 26 and 46 weeks, HFD, ad libitum fed). h 12 h fasted and refed plasma FA (fatty acid; left) and insulin (right) levels (M, HFD, 38 weeks, n = 6–7 animals/genotype). i Insulin signaling in WAT. Mice were injected with insulin at 0.75 IU kg−1 body weight (M, 26 and 44 weeks, HFD, 12 h fasted, n = 3 animals/genotype). Left: quantification of phosphorylation of AKTpSer473/total AKT in PGAT. Right: representative immunoblots. j Left: PGAT protein expression of lipolytic proteins and regulator (ATGL, ABHD5). Right: representative immunoblots (M, 26 and 44 weeks, HFD, 2 h fed, n = 3 animals/genotype). k Triglyceride hydrolase activity in PGAT determined by [3H]-labeled oleic acid release (M, 26 and 44 weeks, HFD, 2 h fed, n = 4–6 animals/genotype). Data represent mean + SEM. Statistical significance was determined by Student’s two-tailed t test. P < 0.05: * for effect of genotype; # for effect of age.

