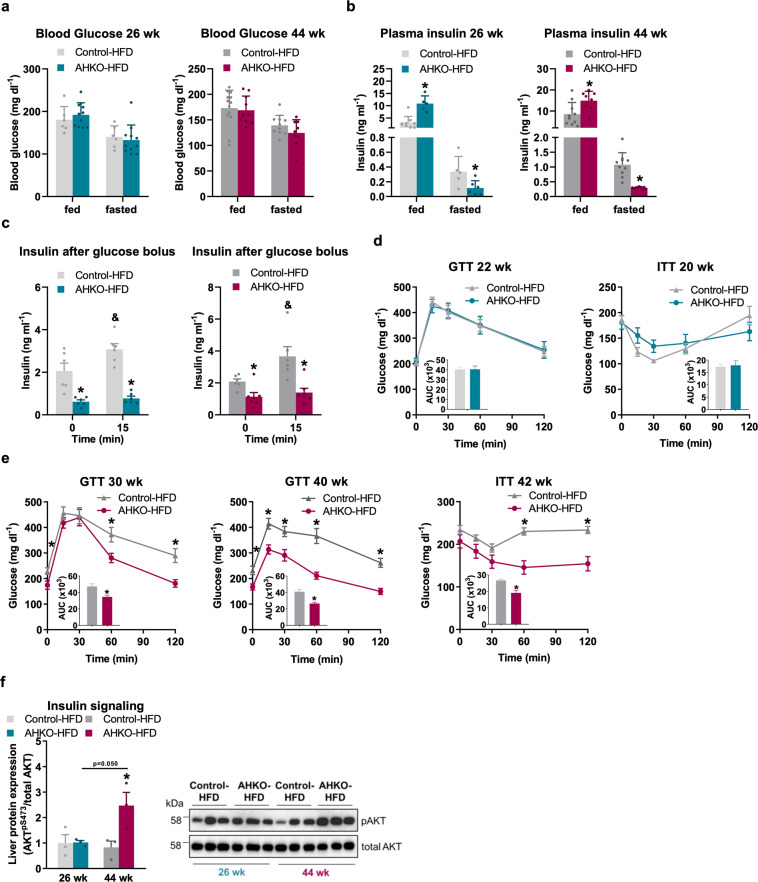
Fig. 6. Effects of adipocyte-specific HSL deletion on systemic glucose homeostasis and insulin action.
a Ad libitum fed and 12 h fasted blood glucose (M, 26 and 44 weeks, HFD, n = 5–9 animals/genotype). b Ad libitum fed and 12h fasted plasma insulin (M, 26 and 44 weeks, HFD, n = 5–9 animals/genotype). c Plasma insulin levels following glucose bolus (1.6 g glucose kg−1 body weight; M, 26 and 42 weeks, HFD, 6 h fasted, n = 6–7 animals/genotype). d Glucose tolerance test (GTT; left) with 1.6 g glucose kg−1 body weight (M, 22 weeks, HFD, 6 h fasted, n = 9–12 animals/genotype). Insulin tolerance test (ITT; right) with 0.75 IU insulin kg−1 body weight (M, 20 weeks, HFD, 4 h fasted, n = 8–11 animals/genotype). e GTT (left, middle) with 1.6 g glucose kg−1 body weight (M, 30 and 40 weeks, HFD, 6 h fasted, n = 9–12 animals/genotype). ITT (right) with 0.75 IU insulin kg−1 body weight (M, 42 weeks, HFD, 4 h fasted, n = 9–10 animals/genotype). f Insulin signaling in liver of middle-aged and aged control and AHKO mice. Mice were injected with 0.75 IU insulin kg−1 body weight and tissues were collected after 15 min. Left: quantification of phosphorylation of AKTpSer473/total AKT (M, 26 and 44 weeks, HFD, 12 h fasted, n = 3 animals/genotype). Right: a representative immunoblot. Data represent mean ± SEM. Statistical significance was determined by Student’s two-tailed t test. P < 0.05: * for effect of genotype; & for effect of treatment.

