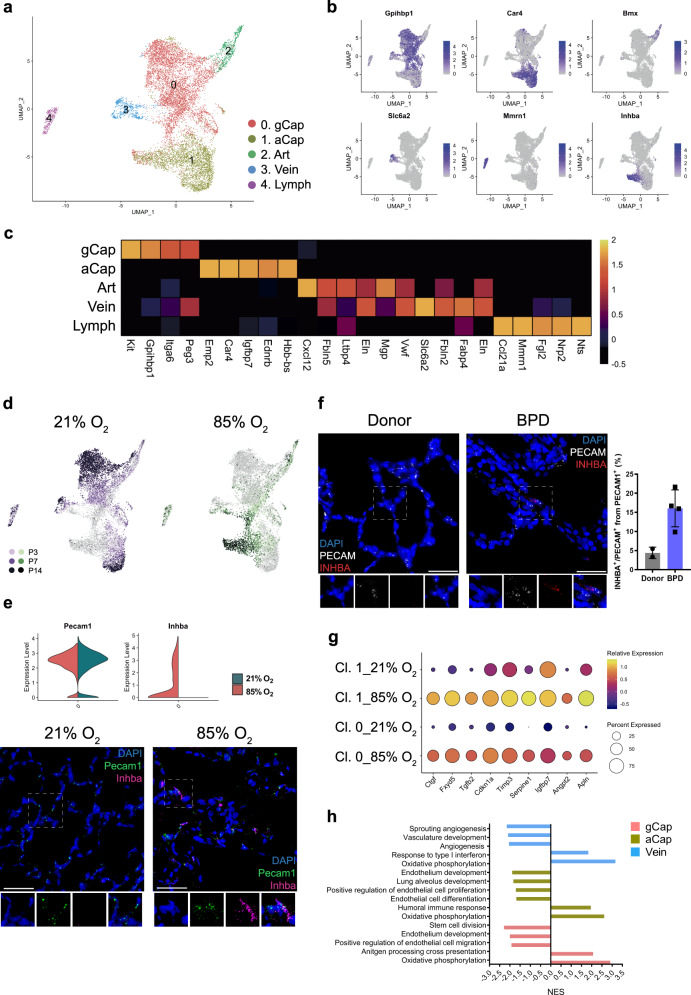
Fig. 5. Cellular composition of lung endothelium during normal and hyperoxia-impaired late lung development.
a A total of five clusters of endothelial cells were identified in developing lungs. Cell populations are colored as indicated by the legend. b UMAP plots of principal identifiers of different types of endothelial cells. The intensity of expression is indicated by purple coloring. c Heatmap of top 5 most differentially expressed genes across endothelial clusters. The intensity of expression is indicated as specified by the color legend. d UMAP plots depicting cell identity in regards to developmental time points in normally (purple) and aberrantly (green) developing lung endothelium. The intensity of expression is indicated as specified by the color legend. Violin plots depicting changes in gene expression of Pecam and Inhba in normoxia (21% O2, green) and hyperoxia-specific (85% O2, red) at P14. e Representative images from fluorescent RNA in situ hybridization for hyperoxia-specific marker Inhba (pink) and pan-endothelial marker Pecam (green) in developing mouse lungs. Magnification: 40×. Scale bar = 40 µm. Two 14-days old animals/group were analyzed. f Representative images and quantitative analysis of fluorescent RNA in situ hybridization for hyperoxia-specific marker INHBA (red) and pan-endothelial marker PECAM (white) in BPD patients’ and donors’ lungs. Samples from five BPD patients and two donor lungs were analyzed. For quantitative analysis, cells in 15 randomly chosen fields of view/sample were analyzed. Magnification: 40×. Scale bar = 40 µm. g Dot plot depicting hyperoxia-induced changes in the expression of inflammatory, anti-angiogenic and protective genes in capillary cells at P14. The intensity of expression is indicated by the color legend. Size of the cell population expressing the gene of interest is indicated by the size of the circle as specified by the legend. h Hyperoxia-impacted signaling pathways in gCap (pink), aCap (yellow), and Vein (blue) clusters, as identified by gene set enrichment analysis (GSEA). All terms are significantly enriched (adjusted p value < 0.05) and normalized enrichment scores (NES) are shown. NES values were computed by gene set enrichment analysis on fold change-ranked genes. Expression values in Heatmap represent Z-score-transformed log(TP10k + 1) values. Expression levels in UMAP plots and Dotplots are presented as log(TP10k + 1) values. Log(TP10k + 1) corresponds to log-transformed UMIs per 10k.

