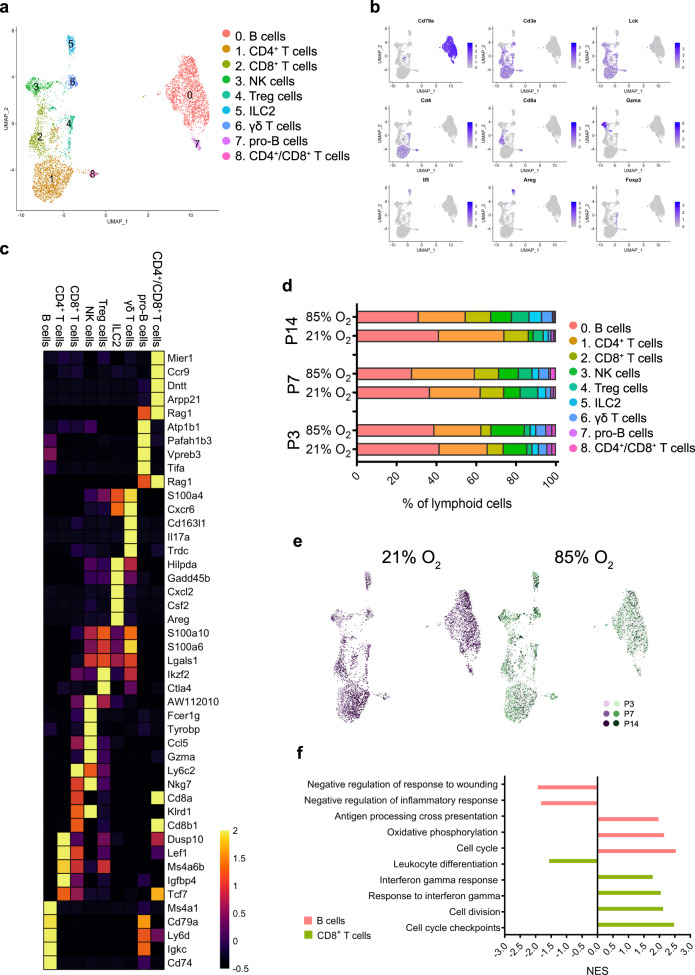
Fig. 7. Cellular composition of lung lymphoid populations during normal and hyperoxia-impaired late lung development.
a A total of nine clusters of lymphoid cells were identified in developing lungs. Cell populations are colored as indicated by the legend. b UMAP plots of principal identifiers of identified types of lymphoid cells The intensity of expression is indicated by purple coloring. c Heatmap of top five most differentially expressed genes across the lymphoid clusters. The intensity of expression is indicated as specified by the color legend. d Relative contribution of individual lymphoid clusters changed significantly during development and exposure to hyperoxia. n = 6 animals/group. Cell populations are colored as indicated by the legend. e UMAP plots depicting cell identity in regard to developmental time points in (21% O2-exposed, purple) normally and aberrantly (85% O2-exposed, green) developing lymphoid populations. Each cell is colored by mouse age as indicated by the legend. f Hyperoxia-impacted signaling pathways in B cells (pink) and CD8 + T cells (bright green) clusters as identified by gene set enrichment analysis (GSEA). All terms are significantly enriched (adjusted p value < 0.05) and normalized enrichment scores (NES) are shown. NES values were computed by gene set enrichment analysis on fold change-ranked genes. Expression values in Heatmap represent Z-score-transformed log(TP10k + 1) values. Expression levels in UMAP plots are presented as log(TP10k + 1) values. Log(TP10k + 1) corresponds to log-transformed UMIs per 10k.

