Figure 2.
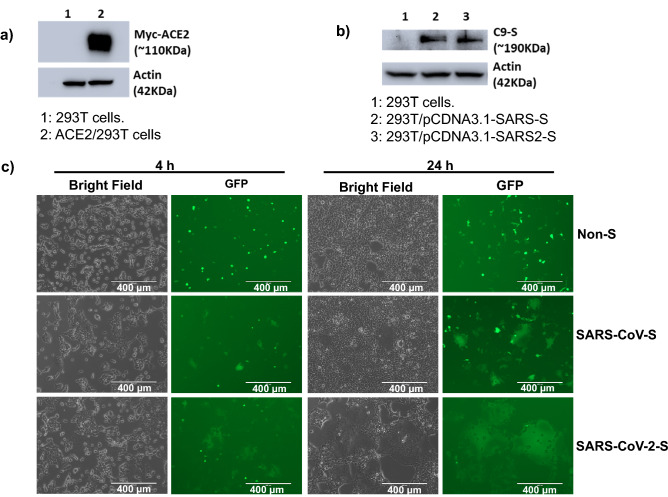
Establishment of SARS-CoV-2-S-mediated cell–cell fusion system. (a) Western blot analysis of S protein expression in 293 T cells transfected with pCDNA3.1-SARS-S and pCDNA3.1-SARS2-S. The two blot images derived from different gels which were run using the same samples. (b) Western blot analysis of ACE2/293 T cells that express ACE2 protein. The two blot images derived from different gels which were run using the same samples. The full blot images for a and b are included in the supplementary figures. (c) Imaging of SARS-CoV-S/293 T and SARS-CoV-2-S/293 T cell fusion with ACE2/293 T cells at 4 h and 24 h. Non-S-transfected cells serve as a negative control. Scale bar equals 400 µm in all figures.

