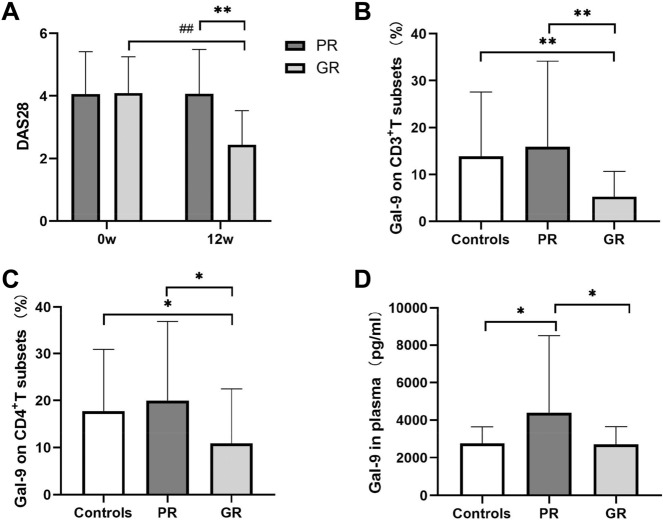
Figure 4.
Disease activity and galectin 9 (Gal-9) levels in tacrolimus (TAC) treatment response groups (n = 52) and controls (n = 58). PR indicates poor response to TAC (n = 22), and GR indicates good response (n = 30). (A) Disease activity score 28 (DAS28). (B) Percentage of CD3+ T cells expressing Gal-9. (C) Percentage of CD4+ T cells expressing Gal-9. (D) Gal-9 expression in plasma. Significant differences between different groups at the same time point are marked as *(P < 0.05) or **(P < 0.01). Significant differences between baseline and 12 weeks within the same group are marked as # (P < 0.05) or ## (P < 0.01).

