FIGURE 2.
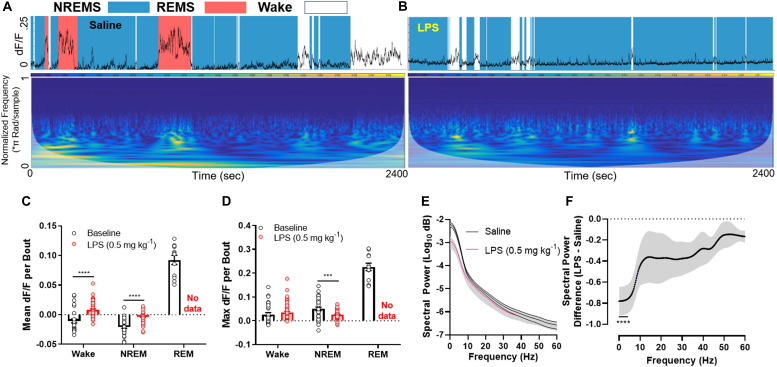
LPS rapidly silences LHGABA neurons. (A) Representative GCaMP6s trace and scaleogram from a mouse 40 min following a saline injection. The trace is shaded by the arousal state the animal was in at the time (based on EEG/EMG recordings), where blue = NREM sleep, red = REM sleep, and white = wakefulness. The colormap for the scaleogram represents the power. (B) representative GCaMP6s trace and scaleogram from the same mouse 40 min following a 0.5 mg kg– 1 LPS IP injection. Note the absence of high amplitude GCaMP signal in tandem with loss of REM sleep. (C) quantification of all data in the experimental set showing the mean dF/F per bout between baseline and LPS groups (wakefulness: t-ratio = 8.239, adjusted p < 0.0001; NREM sleep: t-ratio = 6.057, p < 0.0001). (D) quantification of all data in the experimental set showing the max dF/F per bout between baseline and LPS groups (NREM sleep: t = 4.020, p < 0.001) (Multiple t-tests, Holm–Sidak method). (E) Mean spectral power of the GCaMP6s signal among the entire experimental set for saline and LPS treated mice. Note the disparity in power at the lower (<10 Hz) frequencies. (F) The same data as in panel (E) except the difference is calculated for ease of viewing (2-way RM ANOVA main effect of LPS treatment F1,6 = 11.85, p = 0.0138; main effect of frequency F240, 1440 = 24.74, p < 0.0001; interaction of treatment × frequency F240, 1440 = 11.44, p < 0.0001; individual data points were analyzed using post hoc Sidak’s multiple comparisons test (significance denoted by **** where all values are significant until 4.25 Hz on the x-axis). Note a ∼80% decrease in low frequency power in response to LPS treatment. Error bars represent S.E.M., ****p < 0.0001, ***p < 0.001, and **p < 0.01; N = 4 mice.

