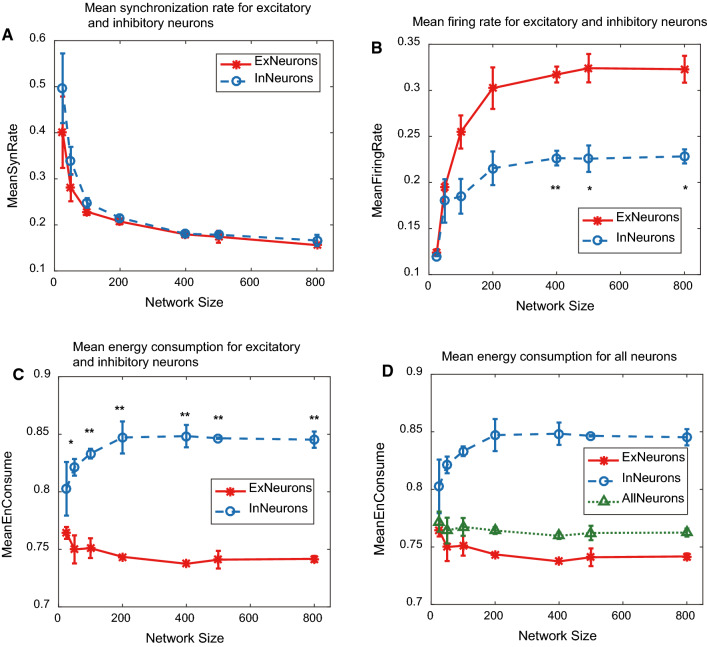
Fig. 1.
The network size-dependent change of three indicators. a Mean synchronization rate for excitatory and inhibitory neurons. b Mean firing rate for excitatory and inhibitory neurons. c Mean energy consumption for excitatory and inhibitory neurons. d Mean energy consumption for all neurons (the green dotted line) in the network. (Color figure online)

