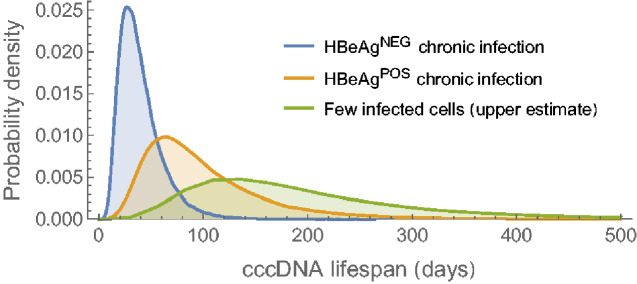
Figure 2.
Probability distributions for cccDNA lifespan during different stages of HBV infection. The distributions for cccDNA in stable HBeAgPOS and HBeAgNEG chronic infection are based on the neutral mutation rate and rate of neutral evolution (orange and blue lines, respectively). If the cccDNA burden during HBeAgNEG infection is not stable, but gradually falling (i.e. the basic reproduction number, R0, is less than one) the lifespan will be slightly less than inferred here. The upper estimate reflects the maximum likely cccDNA lifespan when few cells are infected, based on the neutral rate of evolution during HBeAgPOS infection and assuming no cccDNA survives mitosis (q = 0; green line).

