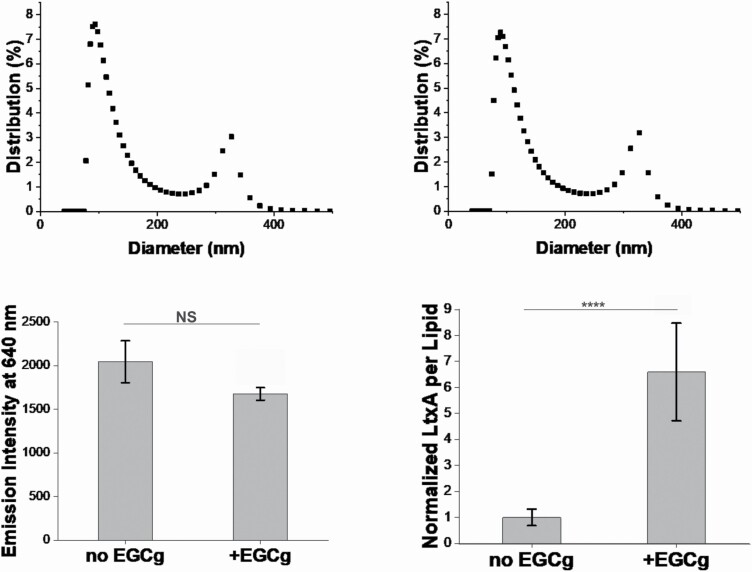
Figure 2.
Characterization of OMVs purified from untreated or EGCg-treated A. actinomycetemcomitans. OMVs were purified from A. actinomycetemcomitans strain JP2 with or without EGCg supplementation. The size distribution of OMVs from untreated A. actinomycetemcomitans (A) and EGCg-treated A. actinomycetemcomitans (B) was studied using DLS. The percentage of OMVs with specific sizes is shown. Data from one representative run (N = 3) are presented. (C) The lipid content of each OMV fraction was quantified using the FM 4‐64 dye, where the emission intensity is proportional to the total lipid content in each OMV fraction. Data are presented as the mean (N = 5) ± standard deviation. (D) The amount of LtxA associated with the OMVs was quantified using ELISA. The intensities of twelve measurements were averaged and the data was normalized to the amount of lipid content in each OMV fraction. Then the values were then normalized to the amount of LtxA per lipid of OMVs purified from untreated A. actinomycetemcomitans. Data are presented as the mean (N = 12) ± standard deviation. The level of significance, relative to untreated control was determined using a Kruskal Wallis test, followed by a Dunn’s posthoc test. NS, not significant; ****, P < 0.0005.

