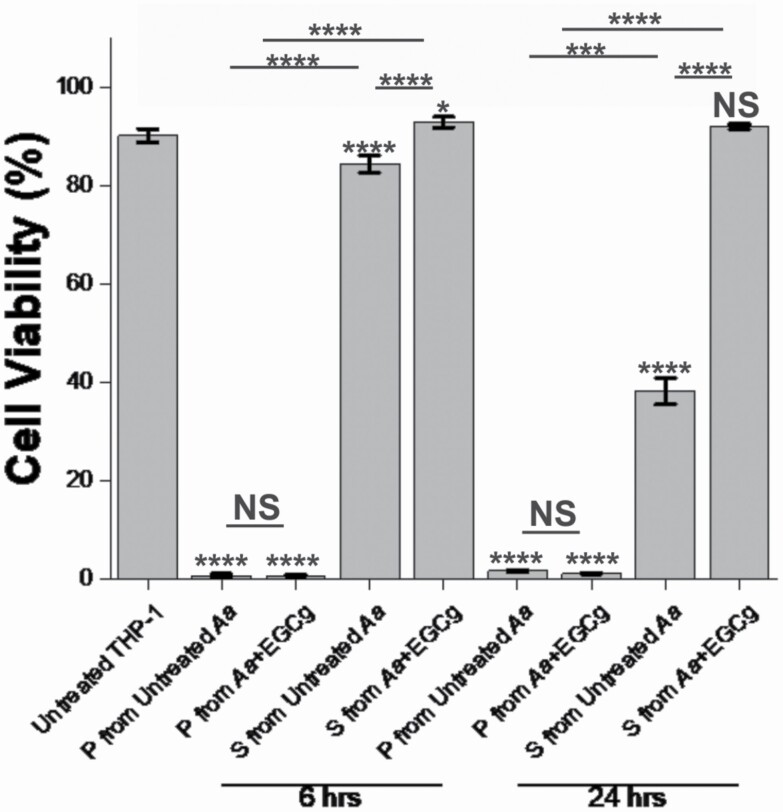
Figure 3.
Cytotoxicity of A. actinomycetemcomitans pellet and supernatant. A. actinomycetemcomitans was grown with or without EGCg, and a 1-mL of the sample from each batch was collected at the six- and 24 h time points. The supernatant (S) and pellet (P) were collected. The cytotoxicity of each was tested using a Trypan blue assay after incubating each sample with 2 × 10⁶ cells/mL of THP-1 cells for 24 h. Data are presented as the mean (N = 5) ± standard deviation. The levels of significance were determined using a Kruskal–Wallis test, followed by a Dunn’s posthoc test. All marked statistical levels are relative to untreated control unless otherwise noted. NS, not significant; *, P < 0.01; ***, P < 0.001; ****, P < 0.0005.

