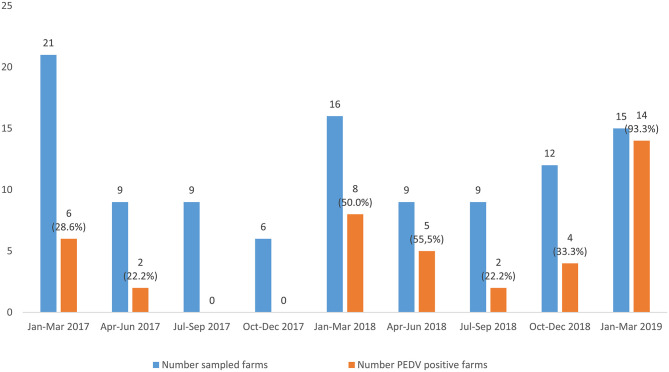
Figure 2.
Distribution of the viral suspected diarrhea outbreaks and PEDV positive outbreaks from January, 2017 to March, 2019. The number of sampled farms and PEDV-positive farms is shown above the columns. The percentage of PEDV-positive outbreaks in each trimester studied. The percentage of PEDV-positive outbreaks in each trimester studied is showed.

