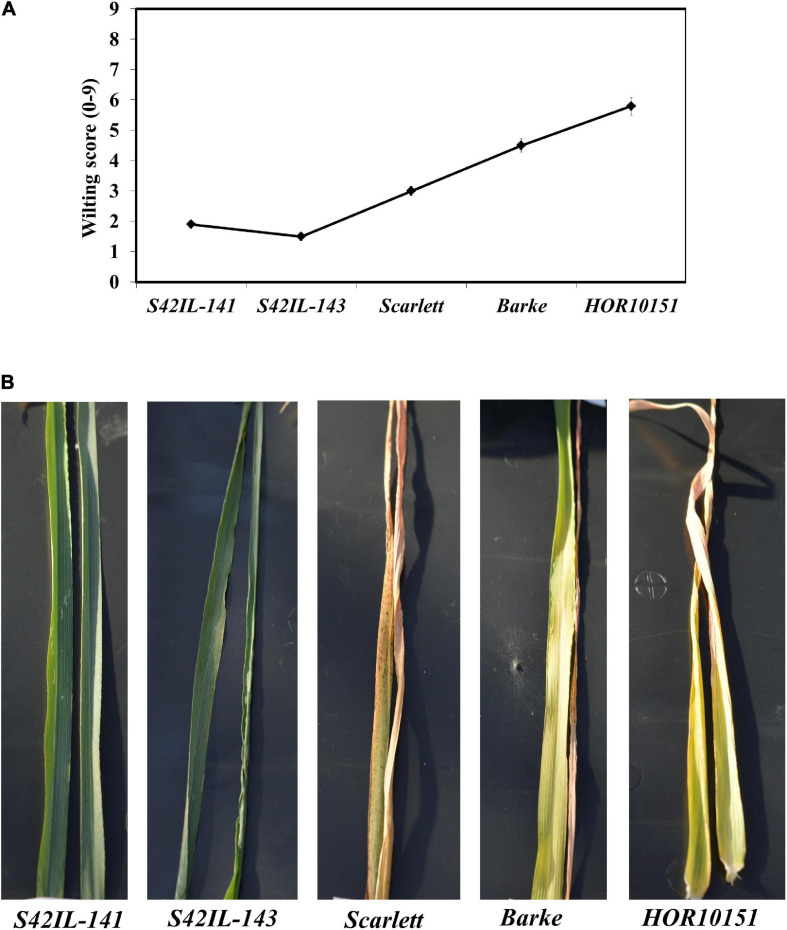
FIGURE 1.
Wilting severity by the different genotypes recorded forenoon, 15 days after onset of water stress adapted from De Datta et al., 1988. (A) Is a line graph depicting wilting scores for each genotype. (B) An illustration of the wilting score/drought symptoms as shown by representative leaves (leaf 5 and 6 fully expanded) of the different genotypes.

