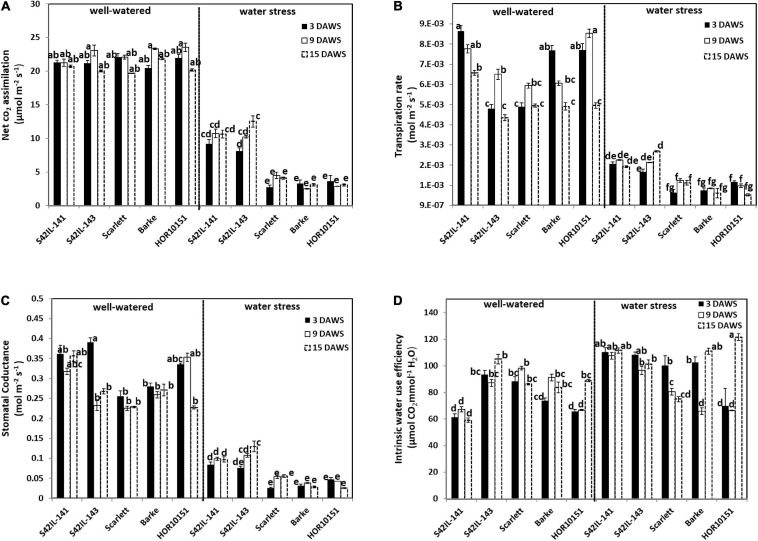
FIGURE 2.
Gas exchange measurements of the different barley genotypes under well-watered and water stress treatment. Measurements were taken at 3, 9, and 15 days after water stress (DAWS), at booting, heading, and the onset of grain filling stages of spike development, respectively. Means and standard error bars are shown. The different letters indicate significant differences in treatment means based on Tukey’s (HSD) test (n = 15). (A) The net CO2 assimilation. (B) Transpiration rate. (C) Stomatal conductance. (D) Intrinsic water use efficiency.

