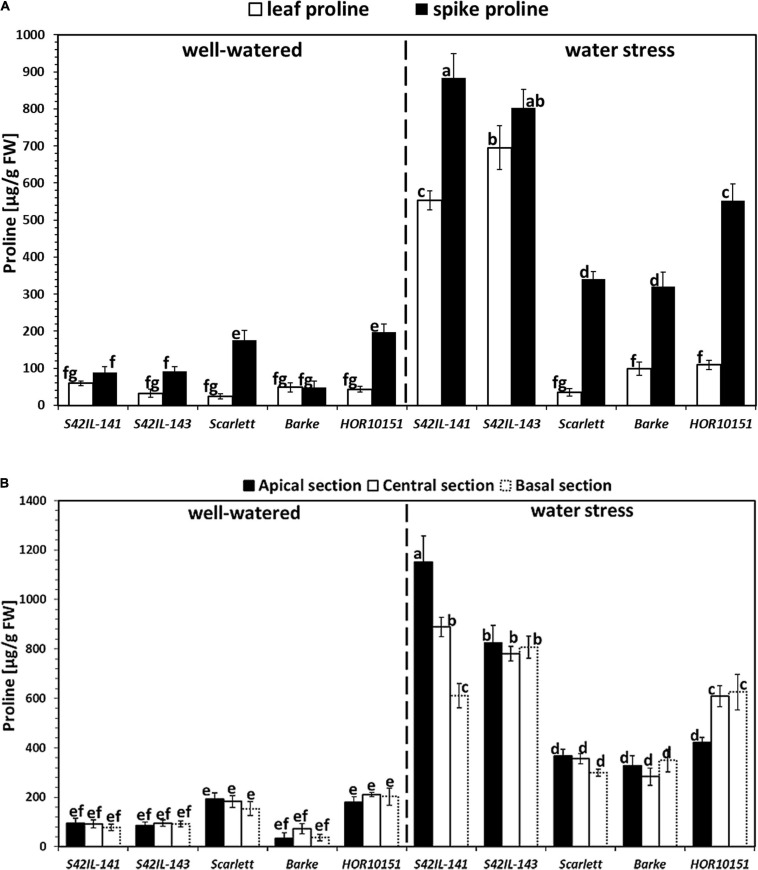
FIGURE 3.
Proline accumulation to the spikes and leaves among the five barley genotypes 15 days after water stress. Different letters on the bars denote significant differences (P ≤ 0.05) according to Tukey’s HSD test (n = 6). (A) Proline concentration to the spike and leaf measurements for 2019 under well-watered and water stress conditions. (B) Spike proline concentrations along the axis of the different spike sections for the 2019 experiment under well-watered and water stress conditions.

