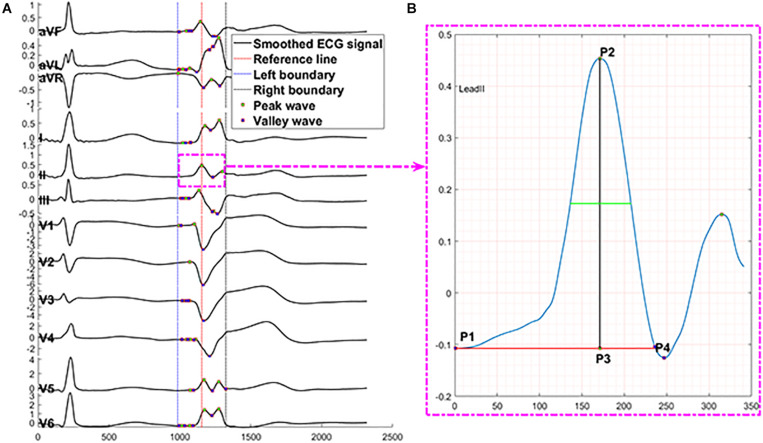
FIGURE 4.
Description of automated ECG feature extraction method. The proposed feature extraction method automatically finds peaks presented by P# and valleys presented by V# in panel (A) through 430 data points of one SR beat in 12 leads. Panel (B) presents the numerical measurements that capture essential information of a peak, including location = sample points at P3, prominence = distance from P2 to P3, distance from peak or valley location to left prominence boundary = distance from P1 to P3, distance from peak or valley location to right prominence boundary = distance from P3 to P4, width at half of the prominence = the length of green line, distance from left prominence boundary to right prominence boundary = distance from P1 to P4, amplitude = distance from P2 to zero baseline, contour height = prominence – amplitude. X-axis presents sampling data points, and Y-axis presents voltage.

