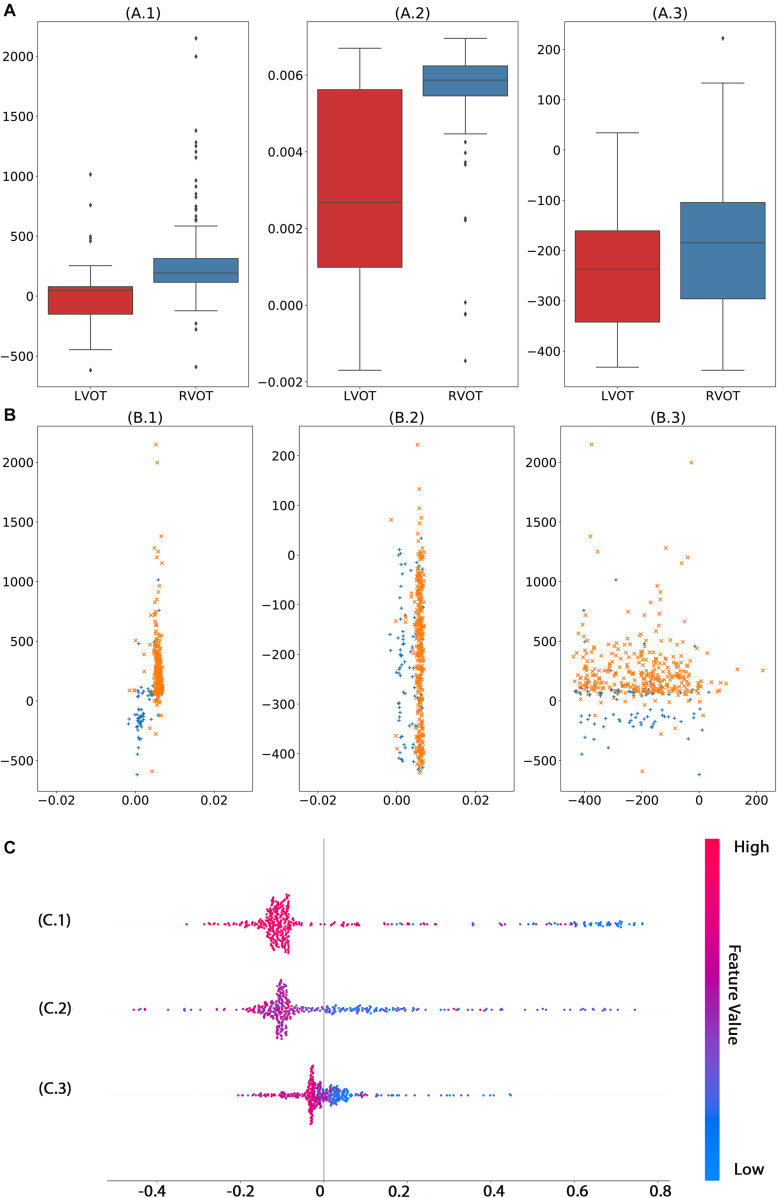
FIGURE 6.
Analysis of top three significant ECG measurements found by machine learning model with automated feature extraction method. The univariate analysis (A) shows that features 1 (A.1) and 2 (A.2) have significant capability to separate RVOT and LVOT. The bivariate analysis (B) indicates the classification ability of one–one interaction of the top 3 significant features. In the multivariate analysis (C), the smaller feature 1 (C.1), feature 1 (C.2), and feature 3 (C.3) generate a higher probability of LVOT, but the magnitude of influence varies across features. The color in panel (C) represents the feature value (red high, blue low).

