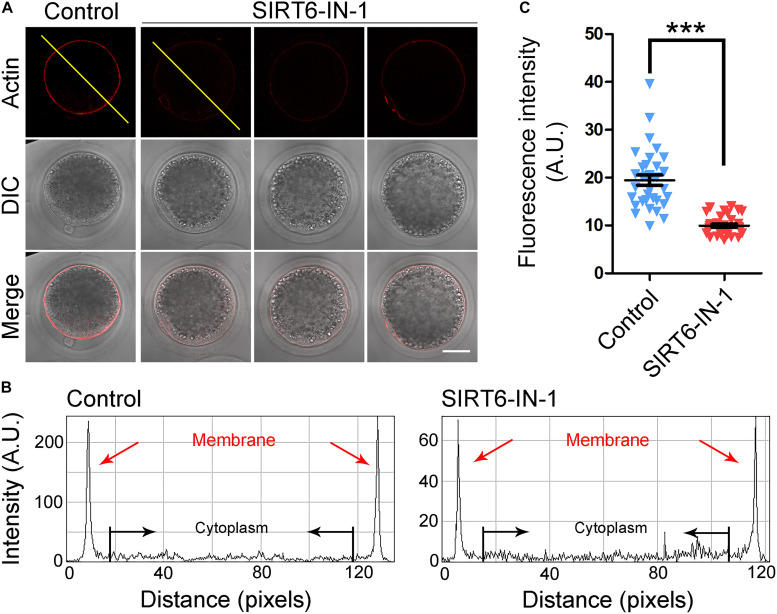
FIGURE 4.
Effect of SIRT6 inhibition on the actin dynamics in porcine oocytes. (A) Representative images of actin filaments in control and SIRT6-inhibited oocytes. Porcine oocytes were stained with phalloidin-TRITC to show the actin filaments. Scale bar, 40 μm. (B) The graphs showed the fluorescence intensity profiling of actin filaments in control and SIRT6-inhibited oocytes. Pixel intensities were measured along the lines drawn across the oocytes. (C) The fluorescence intensity of actin signals was quantified in control and SIRT6-inhibited oocytes. Data were expressed as the mean percentage (mean ± SEM) of at least three independent experiments. ***P < 0.001.

