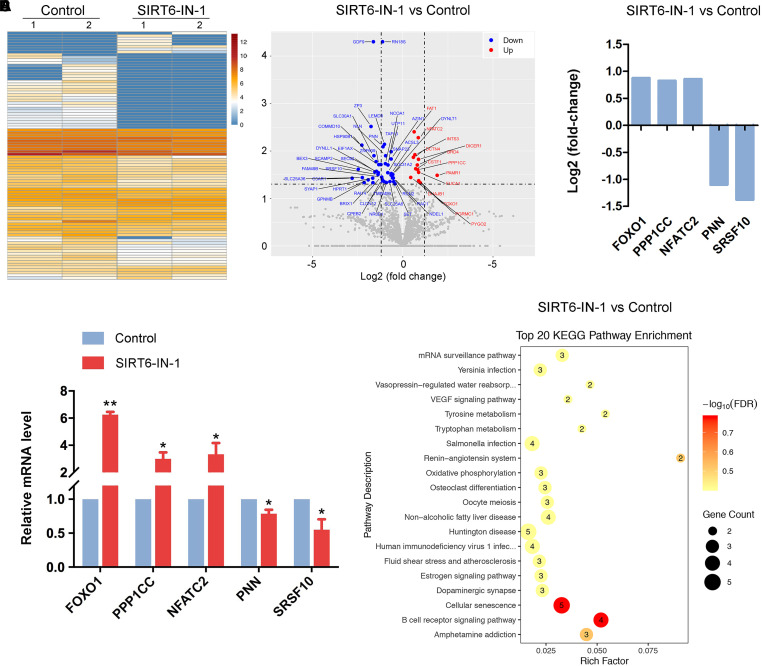
FIGURE 6.
Effect of SIRT6 inhibition on the transcriptome profile of porcine oocytes. (A) Heatmap illustration displayed the differentially expressed genes (DEGs) between control and SIRT6-inhibited oocytes. (B) Volcano plot showed the DEGs in SIRT6-inhibited oocytes compared to controls. Downregulated, blue; upregulated, red. (C) RNA sequencing (RNA-seq) results of selected genes in SIRT6-inhibited oocytes compared to controls. (D) Validation of RNA-seq data by quantitative RT-PCR in control (blue) and SIRT6-inhibited (red) oocytes. Data were presented as the mean percentage (mean ± SEM) of at least three independent experiments. **P < 0.01, *P < 0.05. (E) Kyoto Encyclopedia of Genes and Genomes (KEGG) analysis of DEGs in SIRT6-inhibited oocytes in comparison with controls.

