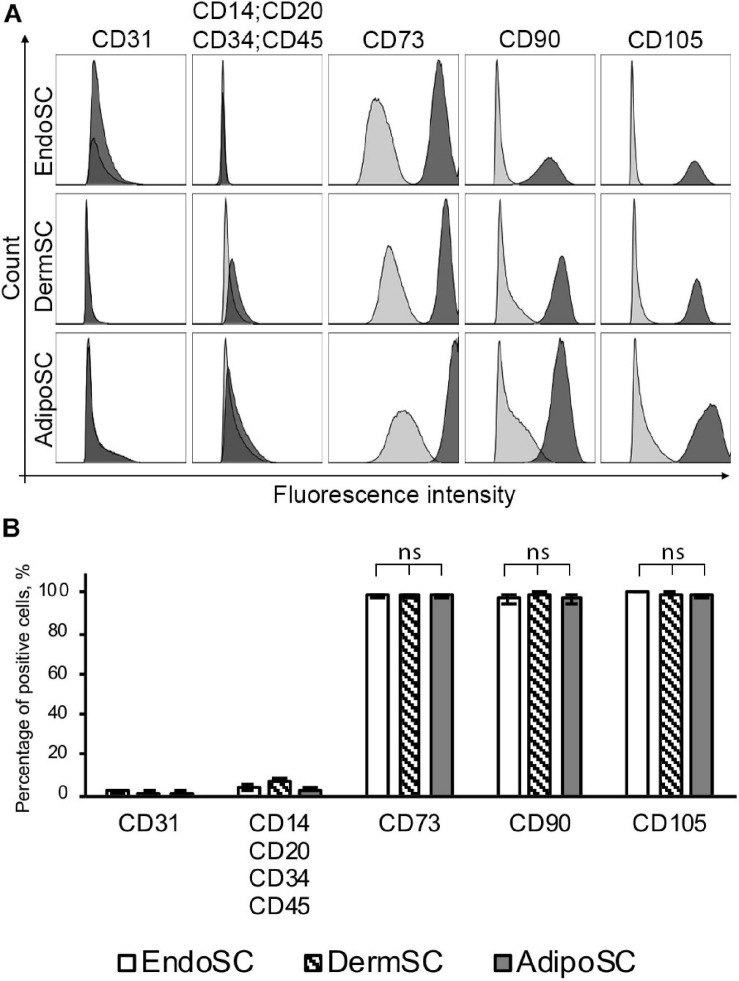
FIGURE 1.
Stromal cells from the endometrium (EndoSCs), dermis (DermSCs), and adipose tissue (AdipoSCs) demonstrate similar immunophenotypes. (A) Representative histograms after flow cytometry of EndoSC, DermSC, and AdipoSC labeled for positive and negative markers of MSC. Distribution of signal intensity from specific antibodies (dark gray) or isotype control IgG (light gray) is plotted on histograms. (B) Quantitative analysis of phenotypic marker distribution in EndoSC, DermSC, and AdipoSC (n = 3 for each cell type). Data presented as mean ± SD; one-way ANOVA used; ns, non-significant statistical difference (p > 0.05).

