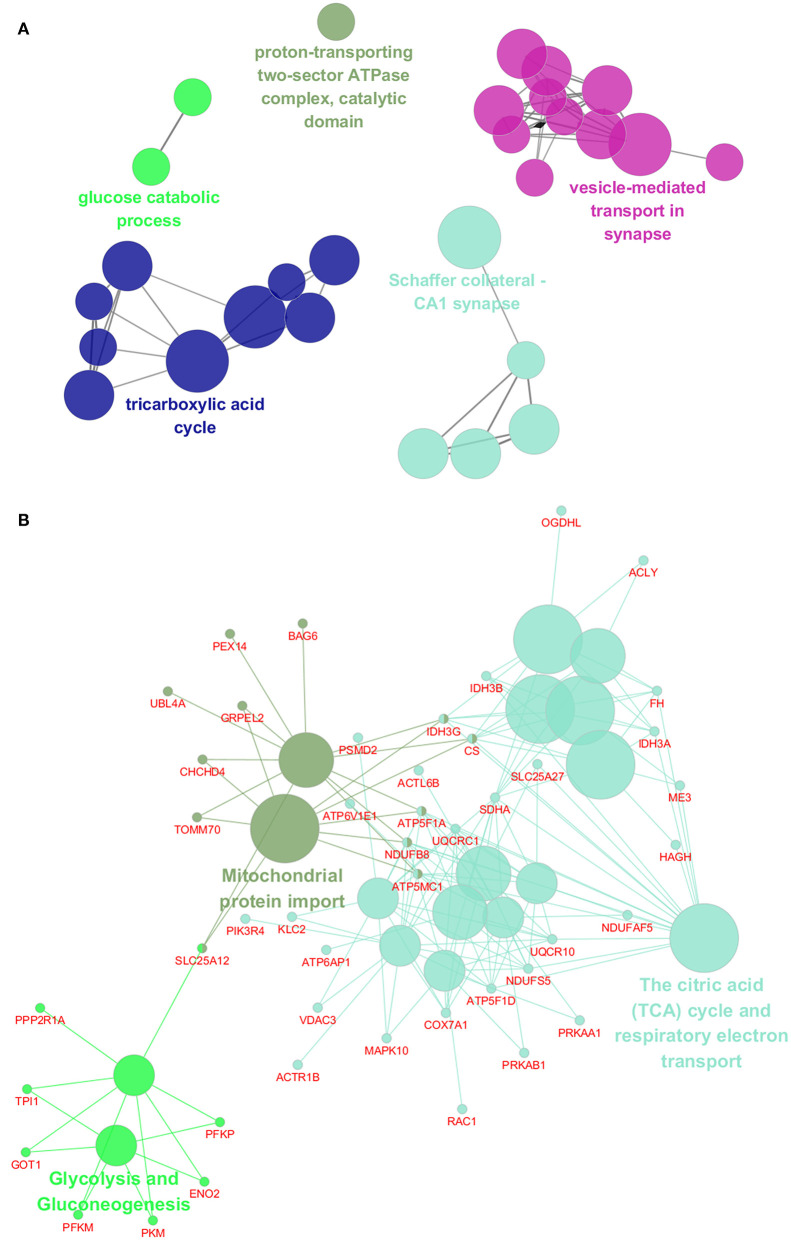
Figure 3.
Functional interaction network analysis of the differentially expressed genes. (A) The differentially expressed genes were mapped to the GO categories, including biological processes and cellular components by using ClueGO cytoscape plugin. (B) The differentially expressed genes were mapped to the KEGG pathway, REACTOME pathway, and Wiki pathway by using ClueGO cytoscape plugin.

