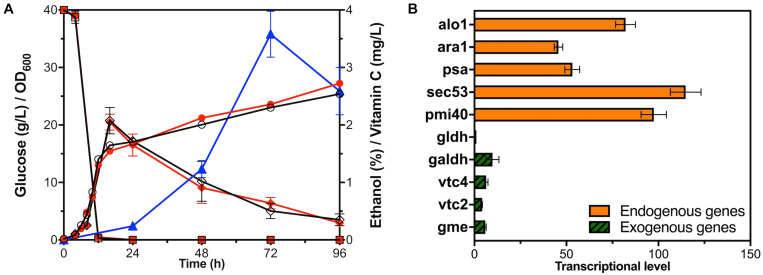
FIGURE 2.
Fermentation and transcriptional level analysis of YLAA. (A) Time courses showing changes in cell concentration (circles), glucose consumption (squares), ethanol production (rhombuses), and VC production (triangles) of YLAA (red solid) and BY4741 (black hollow) during fermentation. (B) The transcriptional level of genes involved in the VC biosynthetic pathway in strain YLAA. The control gene is Gene gldh. Error bars represent ± standard error of mean (SEM, n = 3).

