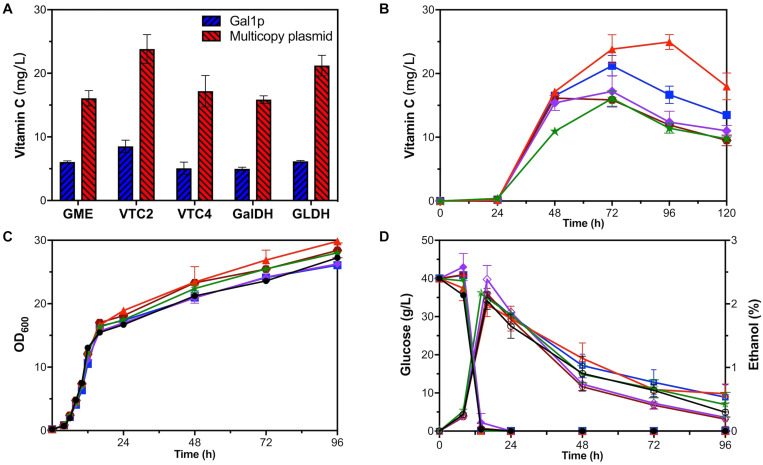
FIGURE 4.
Fermentation of one-gene-module overexpression strains. (A) VC production of GAL1p overexpression strains (blue) and multicopy plasmid overexpression strains (red). Time courses showing changes in (B) VC production, (C) cell concentration, (D) glucose consumption (solid), and ethanol production (hollow) of GME-M (green stars), VTC2-M (red triangles), VTC4-M (purple rhombuses), GalDH-M (brown hexagons), GLDH-M (blue squares), and YLAA (black circles).

