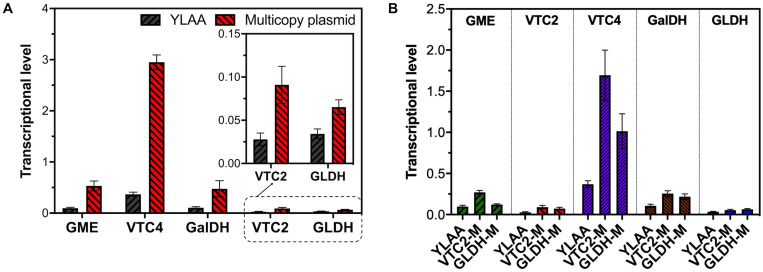
FIGURE 5.
The transcription level of multicopy plasmid overexpression stains. (A) The transcription level of corresponding exogenous genes in multicopy plasmid overexpression strains (red) and YLAA (gray). (B) The transcription level of exogenous genes, gme (green), vtc2 (red), vtc4 (purple), galdh (brown), and gldh (blue). The first bar of every group is the transcription level of gene in YLAA. The second one is that in VTC2-M. The third one is that in GLDH-M. Error bars represent ± SEM (n = 3).

