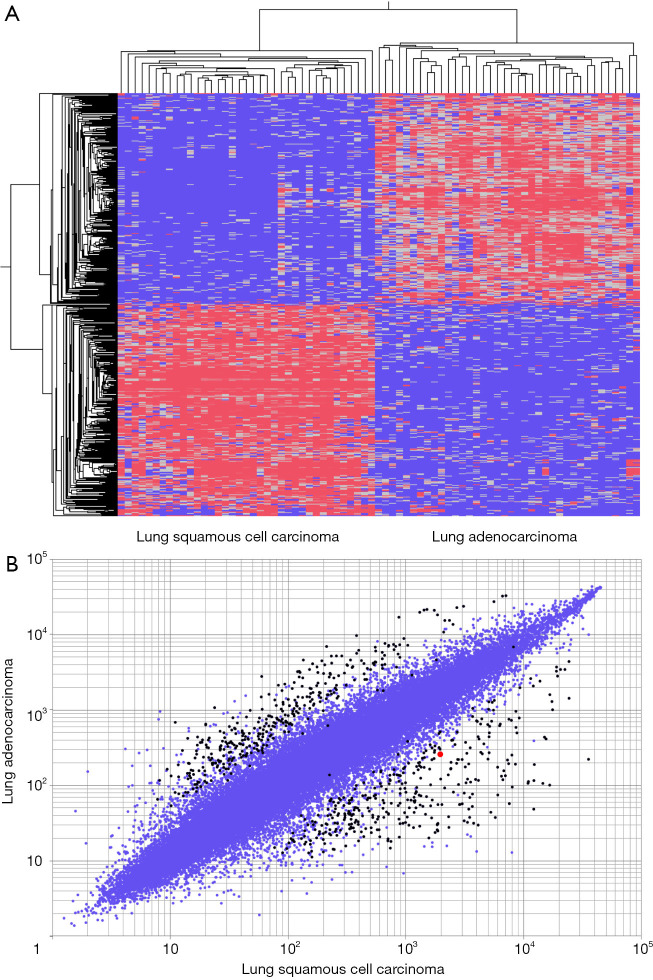
Figure 1.
Gene expression analysis. (A) Supervised hierarchical clustering of 37 lung squamous cell carcinoma and 38 lung adenocarcinoma. Seven hundred three transcripts are differentially expressed by 6-fold change between lung squamous cell carcinoma and lung adenocarcinoma showing 352 upregulated in lung squamous cell carcinoma and 351 upregulated in lung adenocarcinoma. (B) Scatter plot diagram of differential expression of 703 transcripts, shown as black dots, between lung squamous cell carcinoma and lung adenocarcinoma. One transcript of GPC-1, shown as red dot, is upregulated in lung squamous cell carcinoma compared to that in lung adenocarcinoma. Blue dots represent all 54,613 transcripts in this microarray dataset.

