Figure 1.
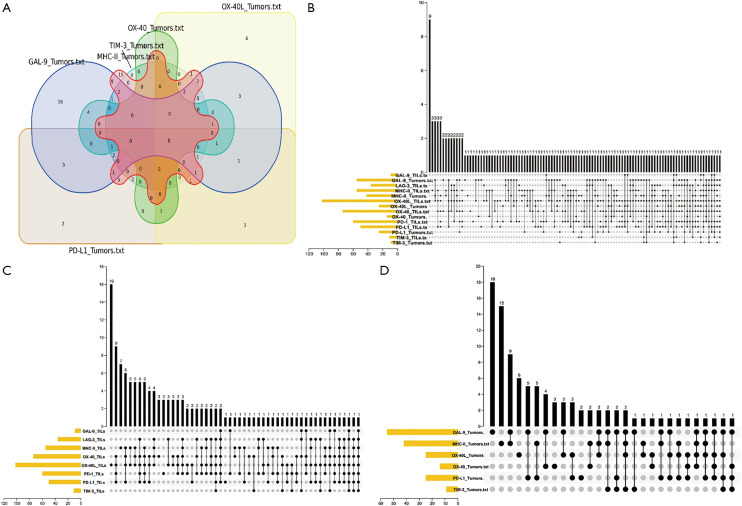
The landscape of Immune Checkpoints expression in non-small cell lung cancer (NSCLC). (A) The landscape of immune checkpoints in non-small cell lung cancer. In the Venn diagram, overlapping sections indicate multiple positive expressions of the same sample, and the number indicated identifies the number of samples in that section. (B) Upset plot displaying the co-expression of immune checkpoints (ICs) in NSCLC and tumor-infiltrating lymphocytes (TILs). In the Upset plot, the horizontal bar on the left shows the number of positives for each ICs, the black bead on the bottom right shows the co-expression of positives for the corresponding ICs, and the vertical bar on the top right shows the number of samples for that combination of ICs. (C) Upset plot displaying co-expression of ICs in TILs. In TILs, OX40L and OX40L were expressed highly. (D) Upset plot demonstrating co-expression of ICs in NSCLC tumor cells, with GAL-9 the highest expression.

