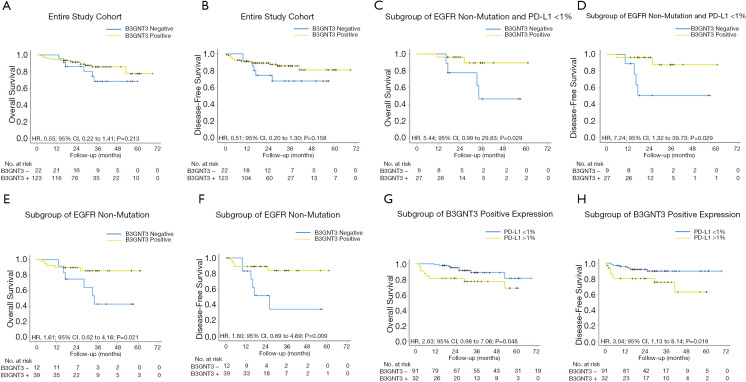
Figure 6.
Kaplan-Meier analysis of OS and DFS according to B3GNT3 expression and PD-L1 expression score in surgically resected lung adenocarcinoma patients. The P value for the difference between the two curves was determined by the log-rank test. PD-L1, programmed cell death-ligand 1; B3GNT3, beta-1,3-N-acetylglucosaminyltransferase 3; OS, overall survival; DFS, disease-free survival.

