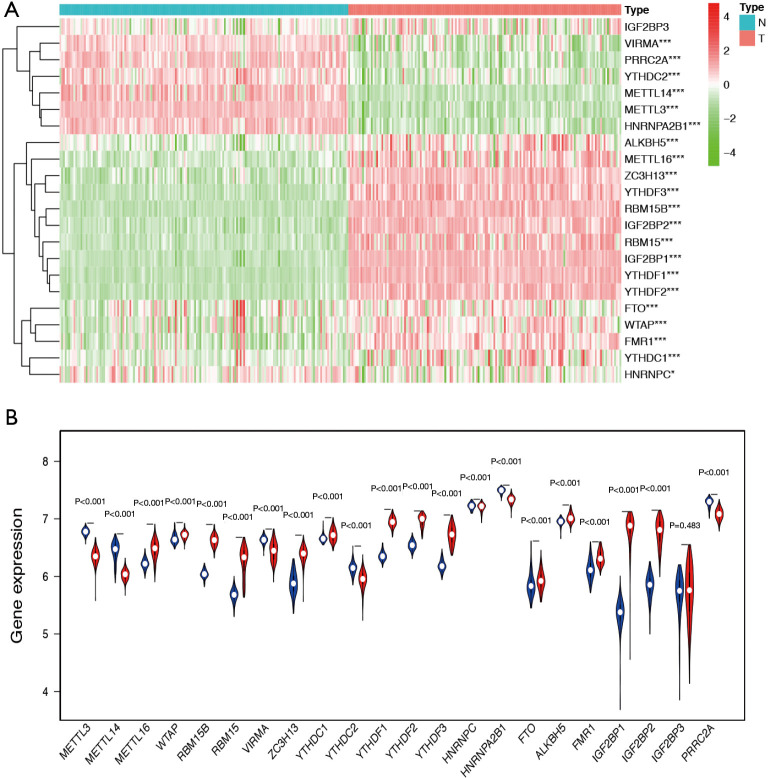
Figure 1.
The differential expression of m6A RNA methylation regulators between TGCT samples and normal tissues. (A) Hierarchical clustering of TGCT and normal tissues expressing the 22 m6A regulatory genes in TCGA and GTEx databases. (B) The expression of 22 m6A regulatory genes between TGCT and normal tissues. The red represents tumor group and blue represents normal tissue group. TCGA, The Cancer Genome Atlas; GTEx, Genotype-Tissue Expression. *, P<0.05 ; ***, P<0.001.

