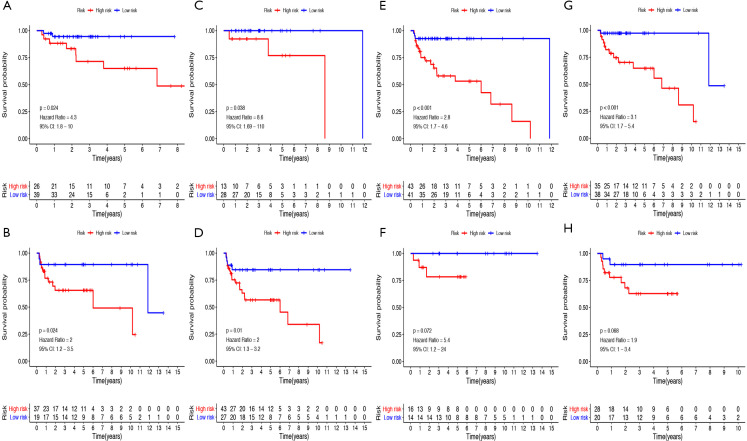
Figure 9.
Prognostic value of the risk score in TGCT patients classified into specific cohorts. Kaplan-Meier survival curve of PFS for patients with (A) seminoma, (B) non-seminoma, (C) serum marker study levels within normal limits, (D) serum marker study levels beyond the normal limits, (E) stage I, (F) stage II-III, (G) no lymphovascular invasion, (H) lymphovascular invasion. TGCT, testicular germ cell tumors; PFS, progression-free survival.

