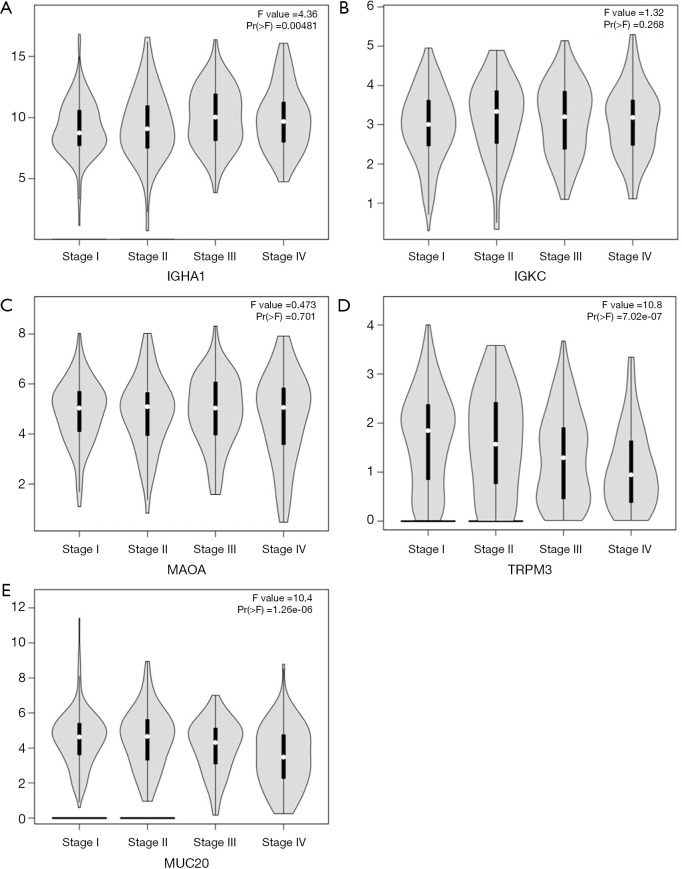
Figure 6.
Gene expression levels of key genes at progressive stages of ccRCC (based on TCGA data in GEPIA) Expression levels of (A) IGHA1, (B) IGKC, (C) MAOA, (D) TRPM3 and (E) MUC20 were significantly correlated, either positively or negatively, to specific stages of ccRCC. GEPIA, Gene Expression Profiling Interactive Analysis.

