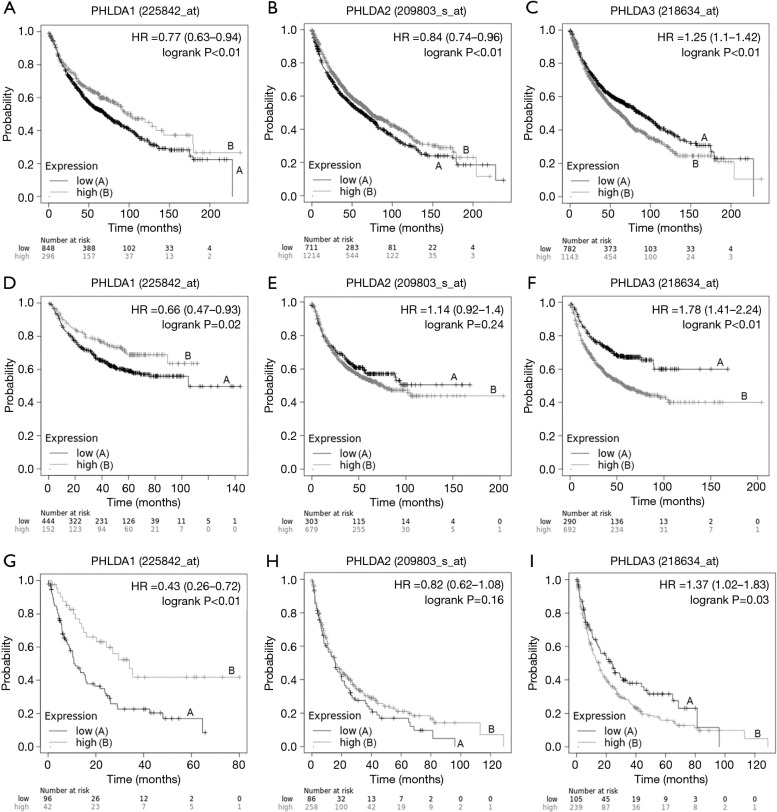
Figure 2.
This Kaplan Meier survival curve shows the correlation between pleckstrin homology domain family A (PHLDA) genes expression and overall survival (OS), first progression survival (FPS) and post progression survival (PPS) in lung cancer patients. (A) Low expression of the PHLDA1 gene was correlated with worse OS (HR =0.77, 95% CI: 0.63–0.94; P<0.01); (B) high expression of the PHLDA2 gene was significantly associated with better OS (HR =0.84, 95% CI: 0.74–0.96; P<0.01); (C) high expression of the PHLDA3 gene also correlated with worse OS (HR =1.25, 95% CI: 1.1–1.42; P<0.01); (D) low expression of the PHLDA1 gene showed a significant correlation with worse FPS (HR =0.66, 95% CI: 0.47–0.93; P=0.02); (E) PHLDA2 gene expression was not statistically significant on FPS (HR =1.14, 95% CI: 0.92–1.40; P=0.24); (F) high expression of the PHLDA3 gene was significantly correlated with worse FPS (HR =1.78, 95% CI: 1.41–2.24; P<0.01); (G) low expression of the PHLDA1 gene showed a significant correlation with worse PPS (HR =0.43, 95% CI: 0.26–0.72; P<0.01); (H) PHLDA2 gene expression was not statistically significant on PPS (HR =0.82, 95% CI: 0.62–1.08; P=0.16); (I) high expression of the PHLDA3 gene was significantly correlated with worse PPS (HR =1.37, 95% CI: 1.02–1.83; P=0.03).

